New Retirement Options Starting in 2024

The SECURE 2.0 Act, passed in December 2022, made wide-ranging changes to U.S. tax laws related to retirement savings. While some provisions were effective in 2023, others did not take effect until 2024. Here is an overview of some important changes for this year:

Matching student loan payments

Employees who make student loan repayments may receive matching employer contributions to a workplace retirement plan as if the repayments were employee contributions to the plan. This applies to 401(k), 403(b), and government 457(b) plans and SIMPLE IRAs. Employers are not required to make matching contributions in any situation, but this provision allows them to offer student loan repayment matching as an additional benefit to help address the fact that people paying off student loans may struggle to save for retirement.

New early withdrawal exceptions

Withdrawals before age 59½ from tax-deferred accounts, such as IRAs and 401(k) plans, may be subject to a 10% early distribution penalty on top of ordinary income tax. There is a long list of exceptions to this penalty, including two new ones for 2024.

Emergency expenses — one penalty-free distribution of up to $1,000 is allowed in a calendar year for personal or family emergency expenses; no further emergency distributions are allowed during a three-year period unless funds are repaid or new contributions are made that are at least equal to the withdrawal.

Domestic abuse — a penalty-free withdrawal equal to the lesser of $10,000 (indexed for inflation) or 50% of the account value is allowed for an account holder who certifies that he or she has been the victim of domestic abuse during the preceding one-year period.

Emergency savings accounts

Employers can create an emergency savings account linked to a workplace retirement plan for non-highly compensated employees.  Employee contributions are after-tax and can be no more than 3% of salary, up to an account cap of $2,500  (or lower as set by the employer). Employers can match contributions up to the cap, but any matching funds go into the employee’s workplace retirement account.

Clarification for RMD ages

SECURE 2.0 raised the initial age for required minimum distributions (RMDs) from traditional IRAs and most workplace plans from 72 to 73 beginning in 2023 and 75 beginning in 2033. However, the language of the law was confusing. Congress has clarified that age 73 initial RMDs apply to those born from 1951 to 1959, and age 75 applies to those born in 1960 or later. This clarification will be made official in a law correcting a number of technical errors, expected to be passed in early 2024.

No more RMDs from Roth workplace accounts

Under previous law, RMDs did not apply to original owners of Roth IRAs, but they were required from designated Roth accounts in workplace retirement plans. This requirement will be eliminated beginning in 2024.

Transfers from a 529 college savings account to a Roth IRA

Beneficiaries of 529 college savings accounts are sometimes “stuck” with excess funds that they did not use for qualified education expenses. Beginning in 2024, a beneficiary can execute a direct trustee-to-trustee transfer from any 529 account in the beneficiary’s name to a Roth IRA, up to a lifetime limit of $35,000. The 529 account must have been open for more than 15 years. These transfers are subject to Roth IRA annual contribution limits, requiring multiple transfers to use the $35,000 limit. The IRS is still working on specific guidance on this law change, so it might pay to wait a few months before making this type of transfer.

Increased limits for SIMPLE plans

Employers with SIMPLE IRA or SIMPLE 401(k) plans can now make additional nonelective contributions up to the lesser of $5,000 or 10% of an employee’s compensation, provided the contributions are made to each eligible employee in a uniform manner. The limits for elective deferrals and catch-up contributions, which are $16,000 and $3,500, respectively, in 2024, may be increased by an additional 10% for a plan offered by an employer with no more than 25 employees. An employer with 26 to 100 employees may allow higher limits if it provides either a 4% match or a 3% nonelective contribution.

Inflation indexing for QCDs

Qualified charitable distributions (QCDs) allow a taxpayer who is age 70½ or older to distribute up to $100,000 annually from a traditional IRA to a qualified public charity. Such a distribution is not taxable and can be used in lieu of all or part of an RMD. Beginning in 2024, the QCD amount is indexed for inflation, and the 2024 limit is $105,000.

SECURE 2.0 created an opportunity (effective 2023) to use up to $50,000 of one year’s QCD (i.e., one time only) to fund a charitable gift annuity or charitable remainder trust. This amount is also indexed to inflation beginning in 2024, and the limit is $53,000.

Catch-up contributions: indexing, delay, and correction

Beginning in 2024, the limit for catch-up contributions to an IRA for people ages 50 and older will be indexed to inflation, which could provide additional saving opportunities in future years. However, the limit did not change for 2024 and remains $1,000. (The catch-up contribution limit for 401(k)s and similar employer plans was already indexed and is $7,500 in 2024.)

The SECURE 2.0 Act includes a provision — originally effective in 2024 — requiring that catch-up contributions to workplace plans for employees earning more than $145,000 annually must be made on a Roth basis. In August 2023, the IRS announced a two-year “administrative transition period” that effectively delays this provision until 2026. In the same announcement, the IRS affirmed that catch-up contributions in general will be allowed in 2024, despite a change related to this provision that could be interpreted to disallow such contributions. The error will be corrected in the 2024 technical legislation.

If you would like to review your current investment portfolio or discuss any other retirement, tax, or financial planning matters, please don’t hesitate to contact us at 734-447-5305 or visit our website at http://www.ydfs.com. We are a fee-only fiduciary financial planning firm that always puts your interests first. If you are not a client yet, an initial consultation is complimentary, and there is never any pressure or hidden sales pitch. We start with a specific assessment of your personal situation. There is no rush and no cookie-cutter approach. Each client is different, and so are your financial plan and investment objectives.

What’s Going on in the Markets November 29, 2023

Who ya’ gonna believe? The headlines or the market?

The latest economic headlines read:

“Credit Card Defaults are on the rise”
“Household savings rates are at historic lows”
“Banking Credit Contracts to Levels Not Seen Since the Global Financial Crisis”
“Home Builder Confidence from the National Association of Homebuilders takes another sharp drop”
“Trucking Employment is Contracting at a rate not seen since the 2000 and 2008 Crises.”
“The Conference Board of Leading Economic Indicators Declined for the 19th consecutive month”
“Yield Curves are Steepening after being extensively inverted, a sign of recession”
“Overdue commercial property loans hit 10-year high at US banks”
“No End in Sight for the Ukraine-Russia War”
“Could The War in the Middle East be the start of World War 3?”
“World Panics as supply of Twinkies Shrinks” (OK I made that one up to see if you’re paying attention)

With headlines like these, you’d think the stock markets were crashing, and we’re already in a deep recession.

Instead, the markets are having one of their best Novembers in history (after an awful October), which has led to headlines like these:

“The stock market is following a rare pattern that could signal double-digit gains next year”
“Extreme investor bearishness suggests stock market gains of 16% are coming in the next 12 months”
“The S&P 500 could soar more than 20% in the next year after an ultra-rare buy signal just flashed”
“This stock market signal points to the S&P 500 surging 25% within the next year”
“The Dow just flashed a bullish ‘golden cross’ Two days after the bearish ‘death cross’ signal”

High inflation and interest rates, two prominent wars, and unprecedented dichotomies continue to mount throughout the market and the economy, which can only mean that Wall Street’s roller-coaster ride is far from over. Let’s take a closer look at some of the headlines driving the markets.

Leading Economic Indicators

The Conference Board’s Leading Economic Indicator (LEI) has warned of trouble all year. It has declined for 19 consecutive months, its third-longest streak on record. When viewed as a ratio with the Conference Board’s Coincident Economic Indicator (CEI), declines from peaks have typically led to recessions. When decreasing, this ratio provides evidence that coincident indicators are holding up, but leading indicators are deteriorating. The Leading-to-Coincident Ratio has steeply declined since its peak in December 2021. Never has this ratio fallen this far and at such a rapid rate without a corresponding recession.

Treasury Yields

Another warning sign still flashing red and has a near-perfect track record for predicting recessions is the yield spread between 10-year and 2-year Treasurys.

Typically, one would expect to receive a higher interest rate on longer-duration bonds, CDs, debt, etc. After all, the more time a debt is outstanding, the more risk the lender takes (e.g., default risk, interest rate risk, bankruptcy, death, etc.). 10-year Treasurys should normally pay a higher interest rate than 2-year Treasurys to compensate lenders (the public) for this added risk.

An inversion means shorter-duration Treasurys command a higher interest rate than longer-duration Treasurys. Historically, inversions are unusual and indicate the economy is vulnerable. After all, if you’re concerned about the economy, it means you’re concerned about corporations being able to pay back their debt. Hence, you’re more likely to buy shorter-term debt. That pushes shorter-term interest rates into inversion. Simply put, if you had concerns about your brother-in-law paying back a personal loan, you’re more likely to keep the term shorter rather than longer, right?

The most recent inversion of the 10-year treasury bill and the 2-year treasury bill interest rates began in July of 2022 and quickly became its deepest (widest) since the early 1980s. The initial inversion is an early warning sign of a potential oncoming recession, but when this yield spread moves back above 0.0 (or it un-inverts), historically, there are four months on average before the onset of a recession. So, this is another definite recession warning sign.

Institute for Supply Management (ISM) Economic Indicators

A few macroeconomic indicators bounced back from dire levels or improved earlier this year, spurring hopes of a soft landing. However, unfortunately, many of these improvements have recently reversed course.

The ISM manufacturing index, also known as the purchasing managers’ index (PMI), is a monthly indicator of U.S. economic activity based on a survey of purchasing managers at more than 300 manufacturing firms. It is a key indicator of the state of the U.S. economy. The PMI measures the change in production levels across the U.S. economy from month to month. The PMI report is released on the first business day of each month.

The 50 level in the PMI (both manufacturing and services) is the demarcation between economic expansion and contraction. Above 50, it’s expanding; below 50, it’s contracting.

Late last year, the ISM Manufacturing PMI index fell into contraction territory (<50.0) and has yet to move back into expansion. It has contracted for 12 consecutive months, showing some improvement mid-year before dropping once again in October.

The ISM Non-Manufacturing (or services) Index is an economic index based on surveys of more than 400 non-manufacturing (or services) firms’ purchasing and supply executives. The ISM Services PMI comes out in the first week of each month and provides a detailed view of the U.S. economy from a non-manufacturing standpoint.

The ISM Services Index has been resilient this year, dropping below 50.0 just once since the pandemic. After initially improving in early 2023, it has declined for the past two months and is now at a five-month low. Because more than 70% of the economy is services-based, any contraction would not benefit the whole economy.

Housing and Real Estate

Housing, another major economic sector, accounts for 15-18% of U.S. GDP and is also on somewhat of a roller coaster ride of its own. Despite its improvement earlier this year, home sales have retracted and are at their lowest levels since 2010.

Existing home sales, which comprise most of the housing market, decreased 4.1% in October 2023 from the level in September to a seasonally adjusted annual rate of 3.79 million, the lowest rate since August 2010, according to the National Association of Realtors. October sales fell 14.6% from a year earlier.

New home sales for October came in lower than expected at 679,000, lower than September’s surprise of 759,000 but slightly higher than August’s 675,000. Despite being below expectations, these numbers are pretty robust (not surprising, given that existing homeowners with low mortgage rates are not selling).

Today’s housing market is still one of the most unaffordable in U.S. history. Home prices have exceeded the extremes of the 2005 housing bubble peak. With today’s high mortgage rates, high home prices, and ever-increasing ownership costs, housing activity seems to be at a standstill overall. Continued declines in home sales would hint at a bursting housing bubble.

On November 8, the Financial Times reported that overdue commercial property loans hit a 10-year high at U.S. banks. The Federal Reserve’s hiking campaign to curb inflation has caused borrowing costs of all types to surge this year, including in commercial real estate. Combined with empty building space from the pandemic work-from-home trend, commercial real estate is in a tight spot. The Green Street Commercial Property Price Index is now down nearly 20% from its 2022 peak and back to a level not seen since the short COVID-induced recession in 2020.

Inflation

While commercial property prices have fallen, price pressures elsewhere have reaccelerated in recent months, prompting consumers to expect inflation to remain elevated in the months ahead. After all, how many items at the grocery or department store have you seen come down in price (besides perhaps eggs and gasoline?)

For October, while headline and Core Consumer Price Indexes (CPI) improved slightly (inflation down), the recent acceleration in consumer inflation expectations indicates that this improvement could be temporary.

In consumer sentiment surveys, the first half of this year saw consumers growing more optimistic about the economy as inflation slowed; however, expectations of future inflation have surged since then, and consumers are becoming discouraged again. Discouraged consumers turn into non-confident consumers who tend to put away their wallets and walk away from discretionary purchases.

Since September, consumer expectations of higher inflation in 12 months have increased significantly to 4.4%. Meanwhile, inflation expectations in five years reached 3.2% as of October’s interim report, their highest level in over a decade. Despite the recent easing in the CPI data, this inflationary expectation pressures the Federal Reserve to keep interest rates elevated.

Inflation expectations notwithstanding, consumers have enthusiastically supported the economy this year despite inflationary challenges. However, the upward trend in credit card delinquency rates indicates an increasingly stressed consumer. Figures from the Federal Reserve show that credit card delinquencies have risen to 2011 levels, and delinquent auto loans are at their highest since 2010. Though not at the extreme levels seen during the Great Financial Crisis (2007-2009), these delinquencies are not slowing and could quickly surge higher if stronger parts of the economy begin to falter.

Jobs

Employment continues to be the last bastion of strength in today’s economy and is important to watch. Jobs remain plentiful, and employees increasingly view employment as transactional (as opposed to long-term). While the unemployment rate remains at historic lows, it has trended upward recently, which could become worrisome.

The unemployment rate in October clocked in at 3.9%, quite low by historical standards but 0.5 percentage points higher than the low rate we saw earlier this year (3.4%).  Increases in the unemployment rate of at least 0.6 percentage points from a cyclical low have confirmed the onset of nearly every recession of the past 50 years, with only one false signal in 1959. Accordingly, the unemployment rate is now just 0.1 percentage points away from reaching this threshold, which would confirm the onset of a recession. The November monthly jobs report and the unemployment rate are scheduled to be released on Friday, December 8.

The Stock Markets: What? Me Worry?

Since the start of November, the S&P 500 Index has been up about 8.5%. The tech-heavy NASDAQ index is up about 10.8%.

Rocket-boosted by the Magnificent Seven tech stocks (Amazon, Apple, Google, Meta, Microsoft, Nvidia, and Tesla), the indexes would not be anywhere nearly as strong without them. While the combined seven stocks are up about 80% year-to-date, the other 493 stocks in the S&P 500 Index are flat. While historically, a handful of stocks “carry” the indexes, we usually see better performance from the rest, and we’re largely not seeing that. Lately, the rally is showing signs of slowly broadening out, which is a good sign going into year’s end.

If you look at the S&P 500 Index on an equal-weight basis (where each stock has an equal “vote,” as opposed to a weighted approach based on company size), the index would be up only 3.8% year-to-date. The Mid-cap 400 index is also up 3.8% year-to-date, and the Small Cap 600 is up 3.3%.

Since we’re in the 4th quarter of a pre-election year, the markets have two reasons to be seasonally positive. True to form, November has reclaimed most of the losses from August to October and looks poised to take out the July high in December. As long as the S&P 500 Index holds the 4400 level, things look good. Daily new high prices among stocks that outnumber new low prices are also encouraging and add to the rally’s strength.

My main concern is with the valuation of the Magnificent Seven Stocks. Compared with the Nifty Fifty Stocks in 1972 and the Tech bubble in 2000, these seven stocks are just as overvalued. Momentum trading combined with valuations this extreme can turn great companies into terrible investments, so buyers at these levels should beware. Should the drive to buy anything related to AI (Artificial Intelligence) cool off in 2024, these seven stocks will have a disproportionate effect on the indexes, driving down the markets quickly, especially since so many portfolio managers have piled into them as “safe havens.” I’m not saying to sell them now, but if you’re overexposed to them and have enjoyed the ride, it would be prudent to trim them at their current levels (this is not a recommendation to buy or sell.)

Recession Watch

A strong consumer, robust labor market, the housing wealth effect, and the lasting effects of a zero interest rate policy held in place too long have made 2023 recession callers look foolish (including me).

Underestimating the U.S. Consumer has always been a bad bet, especially when locked down for months, saving their stimulus checks and unspent wages and ultimately coming out of the gates splurging. While their savings are nearly depleted, I would not completely count them out just yet, and a recession in 2024 is definitely not a sure thing, although I still believe we will have one next year.

As discussed above, there are signs that the post-pandemic fiscal and monetary drugs are starting to wear off for the world’s economies, and a hangover might be on the horizon. Whether and when that hangover turns gross domestic product in a negative direction and, therefore, an economic recession, is anyone’s guess. I like what Bloomberg Points of Return writer John Authers wrote this week on that topic:

“…Having got this far, there’s now a pretty good chance the US can get through the next two years without a recession. But the odds still point more to a downturn. That explains the negativity in opinion polls and surveys of consumers, even if it completely fails to explain the enthusiasm among consumers when they go shopping. And then there’s the issue of stock market sentiment, which is utterly baffling.”

It would be understandable to read this post and think that things look grim and that it’s time to batten down the hatches and sell everything. It’s not. When it comes to discounting the future, the markets usually have it right (looking out 6-9 months), and we may just be experiencing some economic indigestion that will resolve itself, and the stock markets will challenge and exceed the all-time highs in 2024.

Election years are positive for a reason: the incumbents want to be re-elected, so you can’t underestimate the levers they can pull to keep the economy firing on all cylinders and postpone any recession until a later year. Never underestimate what determined politicians can do.

I would like to take this opportunity to wish your family and you a very happy holiday season.

If you would like to review your current investment portfolio or discuss any other financial planning matters, please don’t hesitate to contact us or visit our website at http://www.ydfs.com. We are a fee-only fiduciary financial planning firm that always puts your interests first.  If you are not a client, an initial consultation is complimentary, and there is never any pressure or hidden sales pitch. We start with a specific assessment of your personal situation. There is no rush and no cookie-cutter approach. Each client is different, and so are your financial plan and investment objectives.

Source: InvesTech Research

What’s Going on in the Markets January 7 2016

Have your long-term financial goals changed in the last four days?

Are American companies becoming less valuable because investors in China are panicking?

Is there any reason to think that because Chinese investors are panicking, that Chinese companies are less valuable today than they were a few days ago?

These are the kinds of questions to ponder as you watch the U.S. stock market catch a cold after China sneezed.  In each of the first four trading days of the year, China closed its markets due to a rapid fall in share prices—a move which may have made the panic worse, since it made investors fear being trapped in stocks that are seen as dropping in value.  It’s unclear exactly how or why, but the panic spread to global markets, with U.S. stocks falling 4.9% to mark the worst first-of-the-year drop in history.

For long-term investors, the result is much the same as if you went to the grocery store and discovered that the prices had fallen roughly 5% across the board.  At first, you might think this is a great bargain. But then you might wonder whether the prices will be even lower tomorrow or next week.  One thing you probably WOULDN’T worry about is whether prices will eventually go back up; you know they always have in the past after these sale events expire.

Will they?  The truth is, nobody knows—and if you see pundits on TV say with certainty that they know where the markets are going, your first impulse should be to laugh, and your second should be to check their track record for predicting the future.  Without a working crystal ball, it’s hard to know whether the markets are entering a correction phase which will make stocks even cheaper to buy, or whether people will wake up and realize that they don’t have to share the panic of Chinese investors on this side of the ocean.  The good news is there appears to be no major economic disruption like the Wall Street derivatives mess that triggered the 2008 downturn.  The best, sanest investors will once again watch the markets for entertainment purposes—or just turn the channel.

I overwhelmingly hear pundits predicting a bear market in 2016 (a bear market is defined as a 20% or more decline from the last market peak). “The bull market has gone on way too long, economic data is deteriorating, the Federal Reserve is raising interest rates, geopolitical events spell doom, we’re heading for a recession, oil is going to $1 per barrel” are all reasons our markets are headed for a tumble. Remind yourself that no one knows for sure what might happen, and while a bear market might assert itself in 2016, no one can reliably predict when it will come. All we know for certain is that it sets up opportunities

So what should you do? If you’ve enjoyed nice gains in your portfolio from this bull market, then you should consider cashing in some of those gains. It never hurts to take some money “off the table” and have some cash reserves to take advantage of better prices. Don’t panic sell–wait for the inevitable bounce that always comes after a multi-day selloff. You’ll be glad you did.

If you’d rather not tax the tax hit on your gains, there are ways to hedge your portfolio so you can at least sleep better at night. Speaking of that, if you’re up at night worrying about your portfolio, then you need to figure out whether you’ve taken on too much risk for your temperament and investing time horizon. You should first discuss all of this with your financial advisor/planner. Don’t have one? We’re glad to help.

As for our clients, we’ve been raising cash and doing some hedging ourselves over the past year. While there are some concerning recent economic trends and technical market anomalies, we don’t see signs of an impending recession on the horizon. We look for indications of a recession, because recessions usually lead to bear markets.

Nothing in this note should be construed as investment advice or a recommendation to buy or sell any security. If you would like to review your current investment portfolio or discuss any other financial planning matters, please don’t hesitate to contact us or visit our website at http://www.ydfs.com. We are a fee-only fiduciary financial planning firm that always puts your interests first.  If you are not a client yet, an initial consultation is complimentary and there is never any pressure or hidden sales pitch.

Sources:

http://www.ft.com/intl/cms/s/0/f248931e-b4e5-11e5-8358-9a82b43f6b2f.html#axzz3wc533ghn

http://www.ft.com/cms/s/0/bc8c0d60-b54d-11e5-b147-e5e5bba42e51.html?ftcamp=published_links%2Frss%2Fhome_us%2Ffeed%2F%2Fproduct#axzz3wc533ghn

The MoneyGeek thanks guest writer Bob Veres for his contribution to this post

How Do the Markets Really Work?

We all do it.  But what do we really know about investing?  A recent post about investing wisdom features a lot of interesting (and often overlooked) facts and figures, plus some insights from Warren Buffett, Jeremy Siegel, William Bernstein, Nobel laureate Daniel Kahneman and a few economists you may have heard of.

Regarding market predictions, the post had this to say: The phrase “double-dip recession” was mentioned 10.8 million times in 2010 and 2011, according to Google. It never came. There were virtually no mentions of “financial collapse” in 2006 and 2007. It did come. A similar story can be told virtually every year.

According to Bloomberg, the 50 stocks in the S&P 500 that Wall Street rated the lowest at the end of 2011 outperformed the overall index by 7 percentage points over the following year.

Many of the items offered insight into how our investment markets actually work.  For instance:

  • Since 1871, the market has spent 40% of all years either rising or falling more than 20%. Roaring booms and crushing busts are perfectly normal.
  • Apple increased more than 6,000% from 2002 to 2012, but declined on 48% of all trading days during that time period. (Investing is never a straight path up.)
  • Polls show Americans for the last 25 years have said the economy is in a state of decline. Pessimism in the face of advancement is the norm.
  • A broad index of U.S. stocks increased 2,000-fold between 1928 and 2013, but lost at least 20% of its value 20 times during that period. People would be less scared of volatility if they knew how common it was.
  • There were 272 automobile companies in 1909. Through consolidation and failure, three emerged on top, two of which went bankrupt. Spotting a promising trend and identifying a winning investment are two different things.
  • According to economist Tim Duy, “As long as people have babies, as long as capital depreciates, technology evolves, and tastes and preferences change, there is a powerful underlying impetus for growth that is almost certain to reveal itself in any reasonably well-managed economy.”

The post had a few zingers about some of the best-paid executives in the financial and investment community:

  • Twenty-five hedge fund managers took home $21.2 billion in 2013 for delivering an average performance of 9.1%, versus the 32.4% you could have made in an index fund. Hedge funds are a great business to work in — not so much to invest in.
  • In 1989, the CEOs of the seven largest U.S. banks earned an average of 100 times what a typical household made. By 2007, that had risen to more than 500 times. By 2008, several of those banks no longer existed.

And finally, if you want to understand the difference between daily fluctuation and the underlying growth of value in the markets, consider this:

Investor Ralph Wagoner once explained how markets work, recalled by Bill Bernstein: “He likens the market to an excitable dog on a very long leash in New York City, darting randomly in every direction. The dog’s owner is walking from Columbus Circle, through Central Park, to the Metropolitan Museum. At any one moment, there is no predicting which way the pooch will lurch. But in the long run, you know he’s heading northeast at an average speed of three miles per hour. What is astonishing is that almost all of the market players, big and small, seem to have their eye on the dog, and not the owner.”

If you would like to discuss your current portfolio or any financial planning matters, please don’t hesitate to contact us or visit our website at http://www.ydfs.com. We are a fee-only fiduciary financial planning firm that always puts your interests first.  If you are not a client yet, an initial consultation is complimentary and there is never any pressure or hidden sales pitch.

Source:

http://www.businessinsider.com/things-everyone-should-know-about-investing-and-the-economy-2014-12

Investor Know Thyself

In an ideal world, emotions would play a very small role in the way people invest and manage their money. Everyone would thoroughly research their options, maintain realistic expectations, and keep counterproductive habits under control.

But in the real world, even well-informed investors sometimes make emotionally charged decisions that may threaten their ability to stay focused on important financial goals, such as accumulating enough money for retirement. In fact, such missteps are so common that many academics have done extensive research on “investor psychology” or “behavioral finance” to explain why some people tend to keep encountering the same obstacles in their financial lives.

Behavior Insights

As you might imagine, different financial attitudes can result in very different consequences. For example, the behavior known as “anchoring” is the tendency for investors to hold on to a belief based on their own limited experience, despite the availability of contradictory information.

For instance, someone who lived through the Great Depression might be more likely to be a conservative investor, while someone who did very well in the market during the 1990s might tend to be a more aggressive investor. Of course, history shows that that type of decline or growth experienced by such individuals, is more the exception than the norm. As such, one possible result of anchoring is making long-term investment decisions based on misguided performance expectations or incomplete facts.

Overconfidence in one’s own abilities is another mindset that could make it more difficult to achieve lasting financial security. Why? Because it may lead investors to ignore sound advice, misunderstand goals, and potentially implement inappropriate investment strategies. On the other hand, a lack of confidence may be to blame for the “fear of loss” (or “fear of regret”) that causes some nervous investors to adjust their portfolios too often — or not often enough.

You’ve Got Personality

It can also be insightful to think about what type of “financial personality” you have. “Impulsives,” for example, are prone to spending spontaneously and not saving enough. “Planners,” however, are in the habit of setting aside as much as possible and sticking to an appropriate investment strategy.

If you would like to discuss your financial personality or any other financial planning matters, please don’t hesitate to contact us or visit our website at http://www.ydfs.com. We are a fee-only fiduciary financial planning firm that always puts your interests first.  If you are not a client yet, an initial consultation is complimentary and there is never any pressure or hidden sales pitch.

Why Losses Really Do Matter

Everybody who told us that the steep market drops earlier this month wouldn’t last can rightly claim they’re right.  When the S&P 500 was down 7.4% during a two-week sell off, there was no way to know whether we’d have to endure more of the same.  Staying the course turned out to be exactly the right strategy, but that doesn’t mean that we shouldn’t be concerned about downside risk.  In fact, during the downturn, all of us should have been working hard to keep our portfolios from falling as far and as fast as the American indices.

Isn’t this a contradiction?  There is no contradiction between holding on during market downturns and building portfolios that are unlikely to keep pace with a bear market free-fall.  You hold on because no living person knows when the stock markets will recover, but history tells us that they always do seem to recover and eventually deliver returns that are higher, on average, than the returns you get when the money is safely stored under your mattress.

But you also pay attention to downturns because the further your portfolio falls, the harder it is to recover.  There’s actually a rational reason why you tend to fear losses more than you enjoy your gains.

The mathematics show the asymmetrical effect of losses vs. gains.  If your $1 million portfolio loses 10%, falling to $900,000, then it requires an 11.11% gain to get you back where you started.  It doesn’t seem fair, but that’s how it is.  A 20% loss requires a 25% gain, and if your portfolio were to drop 40%, you’d need a subsequent 66.67% gain to climb back to your original $1 million nest egg.

Chances are, you know how we fortify portfolios against losses: we include a variety of different types of assets–including bonds which, against every single market prediction at the start of the year, are actually delivering positive returns almost all the way across the maturity spectrum.  We include foreign stocks, which haven’t exactly been knocking the lights out this year, but which will, someday, offer strong gains when the U.S. markets are weakening.  Also, we take profits on positions that have reached their price targets and hedge portfolios with inverse funds.  All of these different movements tend to have a calming effect on the portfolio’s returns, not always in every circumstance, but fairly reliably over time.

The result?  A smoother ride puts more money in your pocket.  If an investor experienced returns of +20% and -10% in alternate years over the next 20 years, a $100,000 portfolio would grow to just under $216,000.  If a more diversified investor experienced a smoother ride of 10% a year, her portfolio would grow to just under $673,000.  The power of steady compounding is a marvelous thing to see.  The drag of losses can be debilitating to a portfolio’s growth.

You won’t experience either of those trajectories exactly, of course.  But if you can somehow avoid the worst of the market’s falls, even if it means never beating the market during the up-cycles, you raise your chances of long-term success.  If you can do this and remain invested through a lot of uncertainty, like we experienced earlier this month, chances are you’ll enjoy better long-term returns than a lot of the “experts” you see screaming at you to buy or sell on the cable finance channels.

Oh, and that 7.4% drop?  The S&P 500 has to go up 8% to recover the ground it lost in that two-week period.  As of today, we’ve recovered that entire loss.

Evidence for Time Diversification

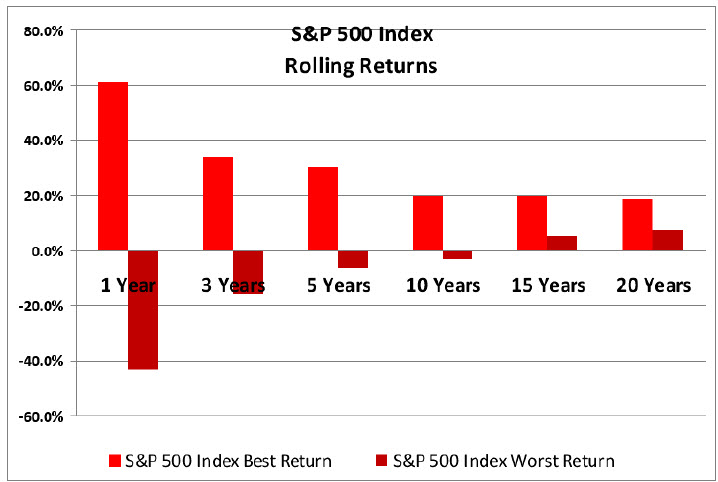
One area where many professional advisors disagree with academics is whether stock investments tend to become less risky as you go out in time. Advisors say that the longer you hold stocks, the more the ups and downs tend to cancel each other out, so you end up with a smaller band of outcomes than you get in any one, two or five year period. Academics beg to disagree. They have argued that, just as it is possible to flip a coin and get 20 consecutive “heads” or “tails,” so too can an unlucky investor get a 20-year sequence of returns that crams together a series of difficult years into one unending parade of losses, something like 1917 (-18.62%), 2000 (-9.1%), 1907 (-24.21%), 2008 (-37.22%), 1876 (-14.15%), 1941 (-9.09%), 1974 (-26.95%), 1946 (-12.05%), 2002 (-22.27%), 1931 (-44.20%), 1940 (-8.91%), 1884 (-12.32%), 1920 (-13.95%), 1973 (-15.03%), 1903 (-17.09%), 1966 (-10.36%), 1930 (-22.72%), 2001 (-11.98%), 1893 (-18.79%), and 1957 (-9.30%).

Based purely on U.S. data, the professional advisors seem to be getting the better of the debate, as you can see in the below chart, which shows rolling returns from 1973 through mid-2009.

dd342ee2-d38b-40ef-b622-583f11f0b02c

The outcomes in any one year have been frighteningly hard to predict, ranging anywhere from a 60% gain to a 40% loss. But if you hold that stock portfolio for three years, the best and worst are less dramatic than the best and worst returns over one year, and the returns are flattening out gradually over 10, 15 and 20 years. No 20-year time period in this study showed a negative annual rate of return.

But this is a fairly limited data set. What happens if you look at other countries and extend this research over longer time periods? This is exactly what David Blanchett at Morningstar, Michael Finke at Texas Tech University and Wade Pfau at the American College did in a new paper, as yet unpublished, which you can find here:
http://papers.ssrn.com/sol3/papers.cfm?abstract_id=2320828.

The authors examined real (inflation-adjusted) historical return patterns for stocks, bonds and cash in 20 industrialized countries, each over a 113-year time period. The sample size thus represents 2,260 return years, and the authors parsed the data by individual time periods and a variety of rolling time periods, which certainly expands the sample size beyond 87 years of U.S. market behavior.

What did they find? Looking at investors with different propensities for risk, they found that in general, people experienced less risk holding more stocks over longer time periods. The only exceptions were short periods of time for investors in Italy and Australia. The effect of time-dampened returns was particularly robust in the United Kingdom, Japan, Denmark, Austria, New Zealand, South Africa and the U.S.

Overall, the authors found that a timid investor with a long-term time horizon should increase his/her equity allocation by about 2.7% for each year of that time horizon, from whatever the optimal allocation would have been for one year. The adventurous investor with low risk aversion should raise equity allocation by 1.3% a year. If that sounds backwards, consider that the timid investor started out with a much lower stock allocation than the dare-devil investor–what the authors call the “intercept” of the Y axis where the slope begins.

Does that mean that returns in the future are guaranteed to follow this pattern? Of course not. But there seems to be some mechanism that brings security prices back to some kind of “normal” long-term return. It could be explained by the fact that investors tend to be more risk-averse when valuations (represented by the P/E ratios) are most attractive (when stocks, in other words, are on sale, but investors are smarting from recent market losses), and most tolerant of risk during the later stages of bull markets (when people are sitting on significant gains). In other words, market sentiment seems to view the future opportunity backwards.

Is it possible that stocks are not really fairly priced at all times, but instead are constantly fluctuating above and below some hard-to-discern “true” or “intrinsic” value, which is rising far more steadily below the waves? That underlying growth would represent the long-term geometric investment return, more or less–or, at least, it might have a relationship with it that is not well-explored. The old saw that stocks eventually return to their real values, that the market, long-term, is a weighing machine, might be valid after all.

If you have any questions about financial or investment planning and management, please don’t hesitate to contact us or visit our website at http://www.ydfs.com. We are a fee-only fiduciary financial planning firm that always puts your interests first.

Bad Money Moves to Avoid

What are truly the very worst investments and financial products you can buy with your money? Those things that when all things are considered provide you the lowest chance for profit. 

According to the AARP, they include five primary types: alternative investments, time-shares, equity-indexed annuities, private and non-traded REITs, and oil drilling partnerships. You can read why each are to be avoided right here. To that list I would add most permanent (whole, universal, variable) life insurance policies, deferred annuities and non-publicly traded partnerships. 
 
In that same article, AARP also provided five clues to watch for to tell you when something isn’t right about an investment that is being sold to you. These are all good things to watch for:
 
1. An impossible promise: There’s no such thing as high returns with little or no risk. The best opportunities typically go to institutional investors: it’s much easier to raise money from a few big fish than to solicit thousands of small fry.
 
2. Complex terms: Perhaps the offer comes with hundreds of pages of technical and legal disclosure, and you’re required to sign a document saying you read and understood it all. Good investments are easy to grasp. My rule is never to buy anything I couldn’t explain to an 8-year-old. Ask yourself: would they write hundreds of (legal) pages to protect you or themselves?
 
3. A ticking clock: If you hear that this investment opportunity is available only for a short time, it’s the reddest of flags. The salesperson doesn’t want you to think it over or ask others for their opinion. Run, don’t walk away from these investments.
 
4. Fancy language: That would be words such as “structured,” “managed,” “deferred,” “derivative,” “collateralized” and even “guaranteed.” Of course, there is nothing wrong with an FDIC guarantee on your CD. But leaving cash at a bank or brokerage firm is a bad investment if you are earning 3 percent or less: you’re losing ground to inflation. A higher-paying CD is a better option if you’re not willing to take risk with your money.
 
5. A stranger calls: Be very careful of accepting a free-lunch “educational seminar.” I have yet to meet someone unknown to me who truly wanted to and could make me rich. Someone once said that you truly can’t afford “free”, and I have come to believe it.
 
Millions of investors fall prey to bad investments usually out of fear or ignorance. In addition, no matter how smart you may be or how much experience you have, studies also show that all of us can be very gullible and blinded by our greed.

Nevertheless, knowing what to avoid is an important part of being successful with investing and managing risk. Most of the time, anything sold to you by others as terrific alternatives to equities and fixed income, especially those with lots of hype, complexity and outrageous fees, must be avoided. Eliminating these bad investments from your consideration and portfolios is a must if you desire to give yourself the best chance for long-term investing and financial success.

If you have any questions about any investments or insurance products you might be considering, please don’t hesitate to contact us or visit our web site athttp://www.ydfs.com. As a fee-only fiduciary financial planning firm, we always put your interests first, and there’s never a charge for an initial consultation.

Sources:

AARP

The Kirk Report

Is myRA Your Next Retirement Plan?

Chances are, you’ve heard about the new myRA retirement savings program that was proposed by President Obama during his State of the Union speech.  But what is it, and how does it relate to the array of other retirement savings options you already have–including, of course, traditional and Roth IRAs, 401(k) or 403(b) plans?  Is this something you need to be looking at in addition to, or instead of one of these other options?
 
The new account, which is scheduled to be introduced later this year, will be offered to workers who currently don’t have access to any kind of retirement program through their employers.  Remarkably, this underserved population is actually about half of all workers, mostly those who work for small companies which have trouble affording the cost of creating and administering a 401(k) plan.  The idea is that a myRA would be so easy to install and implement (employers don’t have to administer the invested assets), and cost so little (virtually nothing), that all of these smaller companies would immediately give their employees this savings option.
 
Only some of the employees would be eligible, however.  Married couples earning more than $191,000, or singles earning more than $129,000, would be excluded from making myRA contributions.  And there is currently no law which says that employers would be required to offer these plans.
 
So the first thing to understand is that people who already have a retirement plan at work, or who earn more than the thresholds, shouldn’t give the myRA option a second thought.
 
Nor, frankly, would those people want to shift over to this option.  Why?  myRA functions much like a Roth IRA, which means that contributions are taxed before they go into the account just like the rest of a person’s salary, but the money will come out tax-free.
 
Anybody can make annual contributions to a Roth IRA; the 2014 maximum is $5,500 for persons under age 50; $6,500 if you’re 50 or older–and these are the same limits that will be imposed on the myRA.  BUT–and this is a big issue–the myRA is not really an investment account.  Any funds that are contributed to a myRA account earns interest from the federal government at the same rate that federal employees earn through the Thrift Savings Plan Government Securities Investment Fund–which is another way of saying that the money will be invested in government bonds.
 
Why does that matter?  Retirement accounts that invested solely in the stock market earned close to 30% from their stock investments last year.  The government bond investments that would have gone into a myRA earned 1.89% last year–which is below the inflation rate.  In real dollars, that was a losing investment.
 
Another big issue is the employer match.  Many workers who have a traditional 401(k) account get some of their contributions matched by their company, which effectively boosts their earnings.  myRA accounts will get no such match.
 
The Obama Administration clearly understands the difference between saving in a government bond account and actual investing.  Accordingly, there is a provision that whenever a myRA account reaches $15,000, it has to be rolled into a Roth IRA, where the money can be deployed in stocks, bonds or anywhere else the account holder chooses.  The program seems to be designed to encourage younger workers to start saving much earlier than they currently do.  Statistics show that the median retirement account for American workers age 25-32 is just $12,000, and 37% have less than $5,000. 
 
Will they be motivated to save when myRAs roll out at the end of the year?  Some commentators have noted that the money can be taken out of the account, for any reason, at any time, with no tax consequences.  That’s not a great formula for long-term savings.  But it does make the myRA account a convenient way for a worker just starting out to build up a cash reserve which could serve as a cushion against job loss or unexpected expenses like car repairs.  If it is not needed, the account could eventually grow into a retirement nest egg.
 
If you have any questions about the myRA or any other investment, retirement or financial planning matter, please don’t hesitate to ask.  We are a fee-only financial planning firm that always puts your interests first.

Using Options To Enhance Portfolio Returns

When people think or hear about using options in their investment portfolios, they tend to think of them as risky instruments that lose their entire value, or worse, cause them to lose multiples of their value. But when used correctly, options can be a powerful tool to help enhance portfolio income, reduce overall portfolio risk, and make risk-defined bets on a stock, sector or fund.

What’s an Option

An option is a financial instrument, tied to or based on an individual stock or exchange traded fund, which gives the purchaser the right, but not the obligation, to buy or sell an underlying stock or fund. Options are unique in that they have a defined price to buy or sell the shares and a limited time to do so.  If you don’t “exercise” your right to buy or sell the shares within the time limit, whatever you pay for the option expires and is lost.

Options are sold as “contracts” for 100 shares each.  Remember, with options, you’re buying the right to buy or sell shares, not the shares themselves

There are two basic kinds of options: calls and puts. Let’s talk about each.

Calls and Puts

Think of calls as options to buy a stock or fund at a certain price. I liken a call to an option to buy a home at a certain price for a defined amount of time.

Let’s say that you’re interested in buying a home for $250,000 but aren’t sure that you can get the financing or whether the house is really worth the asking price. So you might offer the seller a sum of money to hold and sell you the house for $250,000 within 90 days. You might pay him a $2,500 “premium” for that option while you investigate financing or determine the true value of the home. During that time, the seller can’t offer to sell the home to anyone else.

If you can’t secure the financing, or you find out that the house is worth far less than $250,000, then you walk away having spent $2,500 for that right (but not the obligation) for 90 days to buy the home. If the true value of the home turns out to be $200,000, you just saved yourself $50,000 less the cost of the option (or $47,500).  If the value of the home instead turns out to be $300,000, then the seller is still obligated to sell you the house for $250,000. In that case, you would exercise your option and you just made an unrealized profit of $47,500 ($300,000 less $250,000 less the cost of the option or $2,500).

Think of puts as an option to sell a stock or fund at a certain price. In many ways, a put is akin to an insurance policy.

Let’s say that house that you just bought for $250,000 is insured for $250,000 and then burns down for a total loss. In that event, the insurance company would pay you for your loss as you “put” the (burned down) house to them. But in order to do that, you had to pay the insurance company an annual insurance premium of say $2,000. If nothing happens to the home, that premium paid is lost forever.

A Stock Example

Let’s turn the discussion to call options on stocks.

Say that you own 100 shares of Apple common stock currently trading for $500, which you bought for $400 per share and you want to generate additional income on those shares (besides the corporate dividend). To do so, you can sell a call option giving someone the right to “call away” your shares for a per share price of $550 within 45 days. For that sale, someone might pay you $1,000 (you don’t ever know who that someone is, but there’s always a willing buyer at the option exchanges for the right price). Note that there are many prices (called strike prices) that you can choose from to decide where you want to part with your Apple shares.

In this example, if Apple shares move down or never exceed $550 per share by the time the option expires, the buyer of that option will walk away without buying the shares and will be out $1,000, but you’ll be $1,000 richer. In that case, you keep your Apple shares and then repeat the process at a new appropriate sales price. Remember, if the buyer of the option can buy shares on the open market for less than $550, she has no reason to exercise that option.

If, on the other hand, Apple shares are at $575 by expiration, you’ll have to part with your shares for a price of $550 (plus the $1,000 that you pocketed for selling the option). The buyer of the option the exercises her option and then owns the shares and any appreciation over $550. You just made $150 per share profit plus the $1,000 option premium. You can then choose to buy new shares of Apple and repeat the process at a higher option price.  Note that the option buyer can call away the shares any time before they expire, but won’t do so unless the price of the shares is higher than $550.

Of course, with any option, you’re free to be the buyer of the calls to speculate on the price of any stock or fund. In the Apple example above, you could have been the buyer of the call option instead of being the seller and thereby speculate on the price of Apple appreciating.

So what about put options on a stock?

Lets continue the Apple example above. At $500 market value per share, you currently have $100 of unrealized profit per share. Now suppose you’ve become worried about a short-term decline in the overall market or in the price of Apple shares, but you don’t want to sell them yet.  Just in case, you might want a short-term insurance policy in the event that Apple shares tumble. In this case, you might buy a $500 put option for $1,000 to give you the right to “put” those shares to someone else for no less than $500 each.

So if Apple shares drop to $450, you’ll still get $500 for your shares when you exercise your put and the seller of the put will be out $4,000 ($500 minus $450 times 100 shares less $1,000 premium received). However, if the shares of Apple are trading for more than $500 by the expiration of the put option, then the put expires worthless and you’re out $1,000 and the seller pockets $1,000.

Safe Ways To Use Options

By now you may have realized that selling options is a nice way to make some extra income. When you consider that most options expire worthless, it is indeed better to be the “house” selling the options rather than the “bettor” buying the options.

The above examples are greatly simplified to help you with the understanding of options. We’ve left out all the mechanics and nuances of option trading to aid in understanding.

The reason that options get such a bad rap is because most people are buyers of options rather than sellers, and they usually buy far too many of them. Since each option contract is good for 100 shares, you shouldn’t buy or sell more contracts than you would buy or sell an equivalent number of shares of stock. Some people even sell calls on stocks that they don’t own (this is allowed), not realizing that stocks can sometimes go much higher than they can imagine. So if you sell an option “naked”, to a certain extent, you’re taking nearly unlimited risk.

In our client portfolios, we may generate income by selling calls against shares we own, so we only have the risk of the stock being called away. We may also hedge our portfolios with options to take advantage of short-term volatility. We may do so by trading puts, but do so in a risk defined way to minimize our premium outlay or maximize our premium generation. In other words, we don’t take unnecessary unlimited risk bets with options and use them only in the safest ways possible.

Hopefully this post helps you to better understand how we (and you could) use options in your own investment portfolios. Of course, if you want to dabble in options, I highly recommend that you get yourself a good book on options and study it carefully before trying them out. Option investing is where a little bit of knowledge is helpful, but can also be dangerous if you’re not sure what you’re doing.

If you’d like to know more about what we do to enhance and hedge investment portfolios, please don’t hesitate to contact us or just ask any questions.