What Persistent Inflation Could Mean for the U.S. Economy

Economic reports of late seem to point to a weakening economy and stubborn inflation.

On April 30, the Employment Cost Index for the first calendar quarter of 2024 showed a 1.2% increase (4.2% year-over-year); that was 25% higher than the consensus estimate of 0.9%.

The FHFA House Price Index for February 2024 was much hotter than expected, coming in at 1.2% versus 0.1% expected (7.0% year-over-year.) Similarly, the February Case-Shiller 20-City Home Price Index came in at 0.6% versus 0.1% expected (7.3% year-over-year.)

At the same time, two more economic reports were released on April 30.

The Chicago Purchasing Managers’ Index (PMI) was 37.9 (versus 45 expected).

The Conference Board’s Consumer Confidence Index also came in far below expectations (97 versus 104 expected).

The stock markets were understandably confused: Normally, lower economic activity means lower inflation. Instead, what we got was higher inflation and lower economic activity.

In the stock markets, confusion equals selling now and asking questions later. That’s what we are seeing now.

Persistent Inflation

On April 10, 2024, the U.S. Bureau of Labor Statistics released the Consumer Price Index (CPI) for March, and the increase in CPI — the most commonly cited measure of inflation — was higher than expected. The rate for all items (headline inflation) was 3.5% over the previous year, while the “core CPI” rate, which strips out volatile food and energy prices, was even higher at 3.8%. The month-over-month change was also higher than anticipated at 0.4%. (1)

The stock market then dropped sharply on this news and continued to slide over the following days, while economists engaged in public handwringing over why their projections had been wrong and what the higher numbers might mean for the future path of interest rates. Most projections were off by just 0.1% — core CPI was expected to increase by 3.7% instead of 3.8% — which hardly seems earth-shattering to the casual observer. But this small difference suggested that inflation was proving more resistant to the Federal Reserve’s high interest-rate regimen (raising interest rates is one of the most common ways to curb spending and corporate investing to reduce inflationary pressures.) (2)

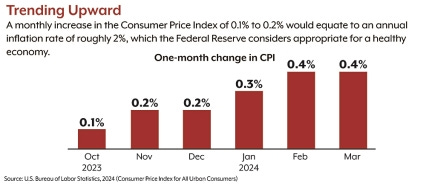
It’s important to remember that the most dangerous battle against inflation seems to have been won. CPI inflation peaked at 9.1% in June 2022, and there were fears of runaway inflation similar to the 1980s. That did not happen; inflation declined steadily through the end of 2023. The issue now is that there has been upward movement during the first three months of 2024.(3) This is best seen by looking at the monthly rates, which capture the current situation better than the 12-month rates. March 2024 was the third increase month that points to higher inflation (see chart).

High for longer

While price increases hit consumers directly in the pocketbook, the stock market reacted primarily to what stubborn inflation might mean for the benchmark federal funds rate and U.S. businesses. From March 2022 to July 2023, the Federal Open Market Committee (FOMC or AKA the Fed) raised the funds rate from near-zero to the current range of 5.25%–5.5% to slow the economy and hold back inflation.

At the end of 2023, with inflation moving firmly toward the Fed’s target of 2%, the FOMC projected three quarter-percentage point decreases in 2024, and some observers expected the first decrease might be this spring. Now it’s clear that the Fed will have to wait to reduce rates. (4)(5)

Higher interest rates make it more expensive for businesses and consumers to borrow. For businesses, this can hold back expansion and cut into profits when revenue is used to service debt. This is especially difficult for smaller companies, which often depend on debt to grow and sustain operations. Tech companies and banks are also sensitive to high rates. (6)

As mentioned above, in theory, high interest rates should hold back consumer spending and help reduce prices by suppressing demand. So far, however, consumer spending has remained strong. In March 2024, personal consumption expenditures — the standard measure of consumer spending — rose at an unusually strong monthly rate of 0.8% in current dollars or 0.5% when adjusted for inflation. (7)

The job market has also stayed strong, with unemployment below 4% for 26 consecutive months and wages rising steadily. (8)

The fear of keeping interest rates too high for too long is that it could slow the economy, but that is not the case, making it difficult for the Fed to justify rate cuts.

What’s driving inflation?

The Consumer Price Index measures price changes in a fixed market basket of goods and services, and some inputs are weighted more heavily than others.

The cost of shelter is the largest single category, accounting for about 36% of the index and almost 38% of the March increase in CPI. (9) The good news is that measurements of shelter costs — primarily actual rent and estimated rent that homeowners might receive if they rented their homes — tend to lag current price changes, and other measures suggest that rents are leveling or going down. (10)

Two lesser components contributed well above their weight. Gas prices, which are always volatile, comprised only 3.3% of the index but accounted for 15% of the overall increase in CPI. Motor vehicle insurance prices comprised just 2.5% of the index but accounted for more than 18% of the increase. Together, shelter, gasoline, and motor vehicle insurance drove 70% of March CPI inflation. On the positive side, food prices comprised 13.5% of the index and rose by only 0.1%, effectively reducing inflation. (11)

While the Fed pays close attention to the CPI, its preferred inflation measure is the personal consumption expenditures (PCE) price index, which places less emphasis on shelter costs, includes a broader range of inputs, and accounts for changes in consumer behavior. Due to these factors, PCE inflation tends to run lower than CPI. The annual increase in March was 2.7% for all items and 2.8% for core PCE, excluding food and energy. The monthly increase was 0.3% for both measures. (12)

Although these figures are closer to the Fed’s 2% target, they are not low enough, given strong employment and consumer spending, to suggest that the Fed will reduce interest rates anytime soon. It’s also unlikely that the Fed will raise rates.

The Fed seems poised to give current interest rates more time to push inflation to a healthy level, ideally without slowing economic activity. (13)

And since higher interest rates mean more competition for investment dollars and lower corporate earnings, stock markets don’t tend to react favorably, especially when 3-4 interest rate cuts were expected earlier this year.

The Fed issues its next interest rate decision on Wednesday afternoon, May 1, 2024. No change in interest rates is all but a given. However, what Federal Reserve Chairman Jerome Powell says about the recent economic data and the Fed’s stance on when future rate cuts are coming will no doubt be parsed word for word for clues when the press conference is convened.

Please pass the popcorn.

If you would like to review your current investment portfolio or discuss any other retirement, tax, or financial planning matters, please don’t hesitate to contact us at 734-447-5305 or visit our website at http://www.ydfs.com. We are a fee-only fiduciary financial planning firm that always puts your interests first. If you are not a client, an initial consultation is complimentary, and there is never any pressure or hidden sales pitch. We start with a specific assessment of your personal situation. There is no rush and no cookie-cutter approach. Each client and your financial plan and investment objectives are different.

Footnotes:

1, 3, 8–9, 11) U.S. Bureau of Labor Statistics, 2024

2)The New York Times, April 10, 2024

4) Federal Reserve, 2023

5) Forbes, December 5, 2023

6) The Wall Street Journal, April 15, 2024

7, 12) U.S. Bureau of Economic Analysis, 2024

10) NPR, April 18, 2024

13) Bloomberg, April 19, 2024

What’s Going on in the Markets November 29, 2023

Who ya’ gonna believe? The headlines or the market?

The latest economic headlines read:

“Credit Card Defaults are on the rise”
“Household savings rates are at historic lows”
“Banking Credit Contracts to Levels Not Seen Since the Global Financial Crisis”
“Home Builder Confidence from the National Association of Homebuilders takes another sharp drop”
“Trucking Employment is Contracting at a rate not seen since the 2000 and 2008 Crises.”
“The Conference Board of Leading Economic Indicators Declined for the 19th consecutive month”
“Yield Curves are Steepening after being extensively inverted, a sign of recession”
“Overdue commercial property loans hit 10-year high at US banks”
“No End in Sight for the Ukraine-Russia War”
“Could The War in the Middle East be the start of World War 3?”
“World Panics as supply of Twinkies Shrinks” (OK I made that one up to see if you’re paying attention)

With headlines like these, you’d think the stock markets were crashing, and we’re already in a deep recession.

Instead, the markets are having one of their best Novembers in history (after an awful October), which has led to headlines like these:

“The stock market is following a rare pattern that could signal double-digit gains next year”
“Extreme investor bearishness suggests stock market gains of 16% are coming in the next 12 months”
“The S&P 500 could soar more than 20% in the next year after an ultra-rare buy signal just flashed”
“This stock market signal points to the S&P 500 surging 25% within the next year”
“The Dow just flashed a bullish ‘golden cross’ Two days after the bearish ‘death cross’ signal”

High inflation and interest rates, two prominent wars, and unprecedented dichotomies continue to mount throughout the market and the economy, which can only mean that Wall Street’s roller-coaster ride is far from over. Let’s take a closer look at some of the headlines driving the markets.

Leading Economic Indicators

The Conference Board’s Leading Economic Indicator (LEI) has warned of trouble all year. It has declined for 19 consecutive months, its third-longest streak on record. When viewed as a ratio with the Conference Board’s Coincident Economic Indicator (CEI), declines from peaks have typically led to recessions. When decreasing, this ratio provides evidence that coincident indicators are holding up, but leading indicators are deteriorating. The Leading-to-Coincident Ratio has steeply declined since its peak in December 2021. Never has this ratio fallen this far and at such a rapid rate without a corresponding recession.

Treasury Yields

Another warning sign still flashing red and has a near-perfect track record for predicting recessions is the yield spread between 10-year and 2-year Treasurys.

Typically, one would expect to receive a higher interest rate on longer-duration bonds, CDs, debt, etc. After all, the more time a debt is outstanding, the more risk the lender takes (e.g., default risk, interest rate risk, bankruptcy, death, etc.). 10-year Treasurys should normally pay a higher interest rate than 2-year Treasurys to compensate lenders (the public) for this added risk.

An inversion means shorter-duration Treasurys command a higher interest rate than longer-duration Treasurys. Historically, inversions are unusual and indicate the economy is vulnerable. After all, if you’re concerned about the economy, it means you’re concerned about corporations being able to pay back their debt. Hence, you’re more likely to buy shorter-term debt. That pushes shorter-term interest rates into inversion. Simply put, if you had concerns about your brother-in-law paying back a personal loan, you’re more likely to keep the term shorter rather than longer, right?

The most recent inversion of the 10-year treasury bill and the 2-year treasury bill interest rates began in July of 2022 and quickly became its deepest (widest) since the early 1980s. The initial inversion is an early warning sign of a potential oncoming recession, but when this yield spread moves back above 0.0 (or it un-inverts), historically, there are four months on average before the onset of a recession. So, this is another definite recession warning sign.

Institute for Supply Management (ISM) Economic Indicators

A few macroeconomic indicators bounced back from dire levels or improved earlier this year, spurring hopes of a soft landing. However, unfortunately, many of these improvements have recently reversed course.

The ISM manufacturing index, also known as the purchasing managers’ index (PMI), is a monthly indicator of U.S. economic activity based on a survey of purchasing managers at more than 300 manufacturing firms. It is a key indicator of the state of the U.S. economy. The PMI measures the change in production levels across the U.S. economy from month to month. The PMI report is released on the first business day of each month.

The 50 level in the PMI (both manufacturing and services) is the demarcation between economic expansion and contraction. Above 50, it’s expanding; below 50, it’s contracting.

Late last year, the ISM Manufacturing PMI index fell into contraction territory (<50.0) and has yet to move back into expansion. It has contracted for 12 consecutive months, showing some improvement mid-year before dropping once again in October.

The ISM Non-Manufacturing (or services) Index is an economic index based on surveys of more than 400 non-manufacturing (or services) firms’ purchasing and supply executives. The ISM Services PMI comes out in the first week of each month and provides a detailed view of the U.S. economy from a non-manufacturing standpoint.

The ISM Services Index has been resilient this year, dropping below 50.0 just once since the pandemic. After initially improving in early 2023, it has declined for the past two months and is now at a five-month low. Because more than 70% of the economy is services-based, any contraction would not benefit the whole economy.

Housing and Real Estate

Housing, another major economic sector, accounts for 15-18% of U.S. GDP and is also on somewhat of a roller coaster ride of its own. Despite its improvement earlier this year, home sales have retracted and are at their lowest levels since 2010.

Existing home sales, which comprise most of the housing market, decreased 4.1% in October 2023 from the level in September to a seasonally adjusted annual rate of 3.79 million, the lowest rate since August 2010, according to the National Association of Realtors. October sales fell 14.6% from a year earlier.

New home sales for October came in lower than expected at 679,000, lower than September’s surprise of 759,000 but slightly higher than August’s 675,000. Despite being below expectations, these numbers are pretty robust (not surprising, given that existing homeowners with low mortgage rates are not selling).

Today’s housing market is still one of the most unaffordable in U.S. history. Home prices have exceeded the extremes of the 2005 housing bubble peak. With today’s high mortgage rates, high home prices, and ever-increasing ownership costs, housing activity seems to be at a standstill overall. Continued declines in home sales would hint at a bursting housing bubble.

On November 8, the Financial Times reported that overdue commercial property loans hit a 10-year high at U.S. banks. The Federal Reserve’s hiking campaign to curb inflation has caused borrowing costs of all types to surge this year, including in commercial real estate. Combined with empty building space from the pandemic work-from-home trend, commercial real estate is in a tight spot. The Green Street Commercial Property Price Index is now down nearly 20% from its 2022 peak and back to a level not seen since the short COVID-induced recession in 2020.

Inflation

While commercial property prices have fallen, price pressures elsewhere have reaccelerated in recent months, prompting consumers to expect inflation to remain elevated in the months ahead. After all, how many items at the grocery or department store have you seen come down in price (besides perhaps eggs and gasoline?)

For October, while headline and Core Consumer Price Indexes (CPI) improved slightly (inflation down), the recent acceleration in consumer inflation expectations indicates that this improvement could be temporary.

In consumer sentiment surveys, the first half of this year saw consumers growing more optimistic about the economy as inflation slowed; however, expectations of future inflation have surged since then, and consumers are becoming discouraged again. Discouraged consumers turn into non-confident consumers who tend to put away their wallets and walk away from discretionary purchases.

Since September, consumer expectations of higher inflation in 12 months have increased significantly to 4.4%. Meanwhile, inflation expectations in five years reached 3.2% as of October’s interim report, their highest level in over a decade. Despite the recent easing in the CPI data, this inflationary expectation pressures the Federal Reserve to keep interest rates elevated.

Inflation expectations notwithstanding, consumers have enthusiastically supported the economy this year despite inflationary challenges. However, the upward trend in credit card delinquency rates indicates an increasingly stressed consumer. Figures from the Federal Reserve show that credit card delinquencies have risen to 2011 levels, and delinquent auto loans are at their highest since 2010. Though not at the extreme levels seen during the Great Financial Crisis (2007-2009), these delinquencies are not slowing and could quickly surge higher if stronger parts of the economy begin to falter.

Jobs

Employment continues to be the last bastion of strength in today’s economy and is important to watch. Jobs remain plentiful, and employees increasingly view employment as transactional (as opposed to long-term). While the unemployment rate remains at historic lows, it has trended upward recently, which could become worrisome.

The unemployment rate in October clocked in at 3.9%, quite low by historical standards but 0.5 percentage points higher than the low rate we saw earlier this year (3.4%).  Increases in the unemployment rate of at least 0.6 percentage points from a cyclical low have confirmed the onset of nearly every recession of the past 50 years, with only one false signal in 1959. Accordingly, the unemployment rate is now just 0.1 percentage points away from reaching this threshold, which would confirm the onset of a recession. The November monthly jobs report and the unemployment rate are scheduled to be released on Friday, December 8.

The Stock Markets: What? Me Worry?

Since the start of November, the S&P 500 Index has been up about 8.5%. The tech-heavy NASDAQ index is up about 10.8%.

Rocket-boosted by the Magnificent Seven tech stocks (Amazon, Apple, Google, Meta, Microsoft, Nvidia, and Tesla), the indexes would not be anywhere nearly as strong without them. While the combined seven stocks are up about 80% year-to-date, the other 493 stocks in the S&P 500 Index are flat. While historically, a handful of stocks “carry” the indexes, we usually see better performance from the rest, and we’re largely not seeing that. Lately, the rally is showing signs of slowly broadening out, which is a good sign going into year’s end.

If you look at the S&P 500 Index on an equal-weight basis (where each stock has an equal “vote,” as opposed to a weighted approach based on company size), the index would be up only 3.8% year-to-date. The Mid-cap 400 index is also up 3.8% year-to-date, and the Small Cap 600 is up 3.3%.

Since we’re in the 4th quarter of a pre-election year, the markets have two reasons to be seasonally positive. True to form, November has reclaimed most of the losses from August to October and looks poised to take out the July high in December. As long as the S&P 500 Index holds the 4400 level, things look good. Daily new high prices among stocks that outnumber new low prices are also encouraging and add to the rally’s strength.

My main concern is with the valuation of the Magnificent Seven Stocks. Compared with the Nifty Fifty Stocks in 1972 and the Tech bubble in 2000, these seven stocks are just as overvalued. Momentum trading combined with valuations this extreme can turn great companies into terrible investments, so buyers at these levels should beware. Should the drive to buy anything related to AI (Artificial Intelligence) cool off in 2024, these seven stocks will have a disproportionate effect on the indexes, driving down the markets quickly, especially since so many portfolio managers have piled into them as “safe havens.” I’m not saying to sell them now, but if you’re overexposed to them and have enjoyed the ride, it would be prudent to trim them at their current levels (this is not a recommendation to buy or sell.)

Recession Watch

A strong consumer, robust labor market, the housing wealth effect, and the lasting effects of a zero interest rate policy held in place too long have made 2023 recession callers look foolish (including me).

Underestimating the U.S. Consumer has always been a bad bet, especially when locked down for months, saving their stimulus checks and unspent wages and ultimately coming out of the gates splurging. While their savings are nearly depleted, I would not completely count them out just yet, and a recession in 2024 is definitely not a sure thing, although I still believe we will have one next year.

As discussed above, there are signs that the post-pandemic fiscal and monetary drugs are starting to wear off for the world’s economies, and a hangover might be on the horizon. Whether and when that hangover turns gross domestic product in a negative direction and, therefore, an economic recession, is anyone’s guess. I like what Bloomberg Points of Return writer John Authers wrote this week on that topic:

“…Having got this far, there’s now a pretty good chance the US can get through the next two years without a recession. But the odds still point more to a downturn. That explains the negativity in opinion polls and surveys of consumers, even if it completely fails to explain the enthusiasm among consumers when they go shopping. And then there’s the issue of stock market sentiment, which is utterly baffling.”

It would be understandable to read this post and think that things look grim and that it’s time to batten down the hatches and sell everything. It’s not. When it comes to discounting the future, the markets usually have it right (looking out 6-9 months), and we may just be experiencing some economic indigestion that will resolve itself, and the stock markets will challenge and exceed the all-time highs in 2024.

Election years are positive for a reason: the incumbents want to be re-elected, so you can’t underestimate the levers they can pull to keep the economy firing on all cylinders and postpone any recession until a later year. Never underestimate what determined politicians can do.

I would like to take this opportunity to wish your family and you a very happy holiday season.

If you would like to review your current investment portfolio or discuss any other financial planning matters, please don’t hesitate to contact us or visit our website at http://www.ydfs.com. We are a fee-only fiduciary financial planning firm that always puts your interests first.  If you are not a client, an initial consultation is complimentary, and there is never any pressure or hidden sales pitch. We start with a specific assessment of your personal situation. There is no rush and no cookie-cutter approach. Each client is different, and so are your financial plan and investment objectives.

Source: InvesTech Research