Lower Oil, Less Looking For It

You already know that oil prices are lower than they have been in a long time, in part because U.S. oil production is higher than it has ever been, and still climbing steeply. But you have to wonder how long these conditions will last, since lower oil prices make it less economical for oilfield services companies to drill.

The below chart, courtesy of the oilfield services company Baker Hughes, may be the most dramatic illustration of economic reality you will see this month. It shows how the U.S. has increased the millions of barrels of oil per day that we’re pumping out of U.S. soil in the past four years. Looking at the orange line rising ever-more-steeply, you wonder whether oil prices will ever go back up to previous levels.

CA - 2014-3-10 Oil Rigs Chart

But then you see the purple line, which tracks the number of active oil rigs that are out there looking for new sources of oil. The last quarter of 2014 and the first few months of this year have created a dramatic bear market for drilling rigs in action. In just two fiscal quarters, the number of rigs in the field has dropped almost by half, and there is no sign that the trend is slowing down.

What does that mean? Nothing in the short term, since the orange line represents existing production. But longer-term, you have to expect that fewer active rigs will mean fewer wells and, at the very least, a leveling out of that orange line. Oil prices may be down today, but that doesn’t mean supplies will outrun demand forever. Enjoy the low gas prices while you can.

If you would like to review your current investment management portfolio or discuss any other financial planning matters, please don’t hesitate to contact us or visit our website at http://www.ydfs.com. We are a fee-only fiduciary financial planning firm that always puts your interests first.  If you are not a client yet, an initial consultation is complimentary and there is never any pressure or hidden sales pitch.

Source:

http://www.bloomberg.com/news/articles/2015-03-06/oil-rigs-get-slammed-for-the-13th-week

TheMoneyGeek thanks guest writer Bob Veres for writing this post.

More Proof that Higher Contributions Are Most Important to Retirement Plan Success

A study by the Putnam Institute, “Defined Contribution Plans: Missing the forest for the trees?” contends that while a number of variables, such as fund selection, asset allocation, portfolio re-balancing, and deferral (contribution) rates all contribute to a defined contribution plan’s effectiveness — or lack thereof — it is deferral rates that should be placed near the top of the hierarchy when considering ways to boost retirement saving success.1

As part of its analysis, the research team created a hypothetical scenario in which an individual’s contribution rate increased from 3% of income to 4%, 6%, and 8%. After 29 years, the final balance jumped from $138,000, to $181,000, $272,000, and $334,000, respectively.

Even with a just a 1% increase — to a 4% deferral rate — the participant’s final accumulation would have been 30% greater than it would have been using a fund selection strategy defined as the “Crystal Ball” strategy, in which the plan sponsor uses a predefined formula to predict which funds may potentially perform well for the next three-year period. Further, the 1% boost in income deferral would have had a wealth accumulation effect nearly 100% larger than a growth asset allocation strategy, and 2,000% greater than rebalancing. Of course these results are hypothetical and past performance does not guarantee future results.

One key takeaway of the study was for plan sponsors to find ways to communicate the benefits of higher deferral rates to employees, and to help them find ways to do so.

Retirement Savings Tips

The Employee Benefit Research Institute reported in 2014 that 44% of American workers have tried to figure out how much money they will need to accumulate for retirement, and one-third admit they are not doing a good job in their financial planning for retirement.2 Are you? If so, these strategies may help you to better identify and pursue your retirement savings goals:

Double-check your assumptions. When do you plan to retire? How much money will you need each year? Where and when do you plan to get your retirement income? Are your investment expectations in line with the performance potential of the investments you own?

Use a proper “calculator.” The best way to calculate your goal is by using one of the many interactive worksheets now available free of charge online and in print. Each type features questions about your financial situation as well as blank spaces for you to provide answers. But remember, your ultimate goal is to save as much money as possible for retirement regardless of what any calculator might suggest.

Contribute more. At the very least, try to contribute enough to receive the full amount of any employer’s matching contribution. It’s also a good idea to increase contributions annually, such as after a pay raise.

Retirement will likely be one of the biggest expenses in your life, so it’s important to maintain an accurate cost estimate and financial plan. Make it a priority to calculate your savings goal at least once a year.

If you would like to review your current deferral rate(s) or discuss any other financial planning matters, please don’t hesitate to contact us or visit our website at http://www.ydfs.com. We are a fee-only fiduciary financial planning firm that always puts your interests first.  If you are not a client yet, an initial consultation is complimentary and there is never any pressure or hidden sales pitch.

Sources:

1Putnam Institute, Defined Contribution Plans: Missing the forest for the trees?, May 2014.

2Ruth Helman, Nevin Adams, Craig Copeland, and Jack VanDerhei. “The 2014 Retirement Confidence Survey: Confidence Rebounds–for Those With Retirement Plans,” EBRI Issue Brief, no. 397, March 2014.

Return on College

Let’s say you’re giving your niece or grandson some advice on which major to select in college. Do you tell them to get an art degree, or take courses in social sciences? Or should they focus on business and finance?

The decision should not ignore their natural abilities and interests, of course. But if they’re looking for the best return on their tuition dollars, then they might consider spending their time in the computer sciences and math buildings.

This information comes from a report published by PayScale.com, which helps people manage their careers and figure out what they’re worth on the job market. PayScale’s research team tracked the median salary for people who completed its salary survey online. They then compared the 20-year earnings of people following different careers with what was earned, on average, by competing workers with a high school diploma but no college degree. Then they subtracted the cost of 4 years of college tuition, to arrive at a return on investment figure—the additional money the degree provided. Advanced degrees like law and medicine were excluded; the survey focused on bachelors degrees.

The results were striking. Business and finance majors came away with a respectable $331,345 average return on investment (ROI) over 20 years, but they actually finished a distant third on the list, just ahead of sales, marketing and public relations ($318,212). The highest ranking majors, by this metric, were computer and math, whose degree-holders saw a net return on their tuition investment of $584,339 over the 20 years after graduation. These nerdy individuals nosed out the architecture and engineering graduates, whose average ROI came to $561,475.

Life, physical and social sciences majors fared somewhat less well, earning almost exactly $250,000 more than their high school diploma competition. Graduates with an arts, design, entertainment and related degree came in last in the survey; they are expected to make a little over $125,000 as a result of their college training.

Interestingly, the PayScale website also tracks the average return on tuition investment for different colleges. Graduates of Harvey Mudd College in Claremont, CA can expect to earn nearly $1 million over the 20 years after graduation, with a typical starting salary north of $75,000—with a 4-year college investment of $237,700. Numbers 2-10 on the rankings include the California Institute of Technology ($901,400 earnings, $221,600 cost); The Stevens Institute of Technology in Hoboken, NJ ($841,000; $232,000), the Colorado School of Mines in Golden, CO ($831,000; $112,000); Babson College in Wellesley, MA ($812,800; $230,200); Stanford University ($809,000; $233,300); the Massachusetts Institute of Technology ($798,500; $224,500); Georgia Institute of Technology ($796,300; $86,700); Princeton University ($795,700; $217,300); and the Virginia Military Institute ($767,300; $95,700).

You can look up your own alma mater here: http://www.payscale.com/college-roi/

If you would like to talk about college planning or discuss any other financial planning matters, please don’t hesitate to contact us or visit our website at http://www.ydfs.com. We are a fee-only fiduciary financial planning firm that always puts your interests first.  If you are not a client yet, an initial consultation is complimentary and there is never any pressure or hidden sales pitch.

Sources:

http://www.payscale.com/college-roi/

http://www.bloomberg.com/news/articles/2015-03-05/the-career-with-the-biggest-financial-payoff?hootPostID=293b20e2f9470947cb0facdcea7f70ea

TheMoneyGeek thanks guest writer Bob Veres for writing this post

Is America in Decline?

In 1945, the U.S. made up more than half of the world’s total gross domestic product (GDP), which basically means that half the world’s economy took place inside U.S. borders. Today that figure is just under 22%.

Does that mean America is in decline?

There seems to be a bull market in doomsayers these past few years, as we’re all reading arguments that the U.S. is slowly losing its grip on global preeminence. The rhetoric today sounds a lot like the hand-wringing back in the 1980s when Japan was allegedly taking over the global economy, and before that, when the Soviet Union had more missiles and a Sputnik circling over our heads.

There’s no easy way to define the overall quality of an economy, but probably the most thorough assessment comes out each year via the World Economic Forum’s Global Competitiveness Rankings. The most recent report ranked 144 countries around the world, including Qatar (16), Moldavia (82), Namibia (88), Lesotho (107) and the unhappy states of Chad (143) and Guinea (144), whose citizens eke out their lives on per capita incomes of $1,218 and $564 a year, respectively.

The survey looks at 12 “pillars” of economic competitiveness, including labor market efficiency, the quality of primary education and higher education, infrastructure, the strength of institutions, innovation, business sophistication, technological readiness and the sophistication of the financial markets. Each of these categories are broken down into dozens of subcategories, which are separately evaluated. For instance, when looking at the strength of each country’s public institutions, the World Economic Forum researchers consider whether people in a given country have strong property rights and intellectual property protection, whether there is corruption and the routine payment of bribes, whether the citizens enjoy judicial independence and a solid legal framework, and how well investors enjoy shareholder protection.

In the most recent survey, the U.S. ranked third overall, with an overall rating of 5.5 on a scale of 1-6. Ahead of it were Switzerland (5.7) and Singapore (5.6). China, the country that you most often hear cited as the all-powerful up-and-coming economy, ranked 28th, two rungs below Saudi Arabia, one rung above Estonia. Brazil and India, which are sometimes mentioned as powerful competitors to U.S. economic hegemony, are ranked 57th and 71st, respectively.

The point of the rankings is to show which countries have created the healthiest (or, in the cases of Chad and Guinea, the least-healthy) economic climate for future growth. But of course there are other ways of measuring competitiveness, including the bottom line (as mentioned at the top of the article) of percentage of the world GDP, and whether you’re moving up or down.

US and Global GDP through 2014

By that standard, the U.S. is indeed moving down. If you look at Figure 1 above, which shows the size of the overall global and U.S. economies since 1991, you see that the U.S. has enjoyed steady economic growth, while the world at large has essentially taken off like a rocket. The years following the collapse of the Soviet Union, when several billion people were suddenly allowed to become capitalists, have been good for world growth. When China shifted from a communist to a capitalist economic posture, this added fuel to the rocket. The democratization of computer technology and the global Internet has empowered value creators everywhere.

The U.S., Europe and Japan, in other words, no longer have a monopoly on capitalism. And that’s a good thing.

Is there a better way of evaluating how the U.S. economy is holding up in an increasingly competitive world? Figure 2 below looks at the first chart from a slightly different angle. Since 1991, what percentage of all the world’s business has been happening in the U.S., vs. Europe, Japan, China, India, Russia and Brazil?   How much of the total global economy did each nation claim in each year, and how has that balance changed over time?

US GDP Market Share through 2014

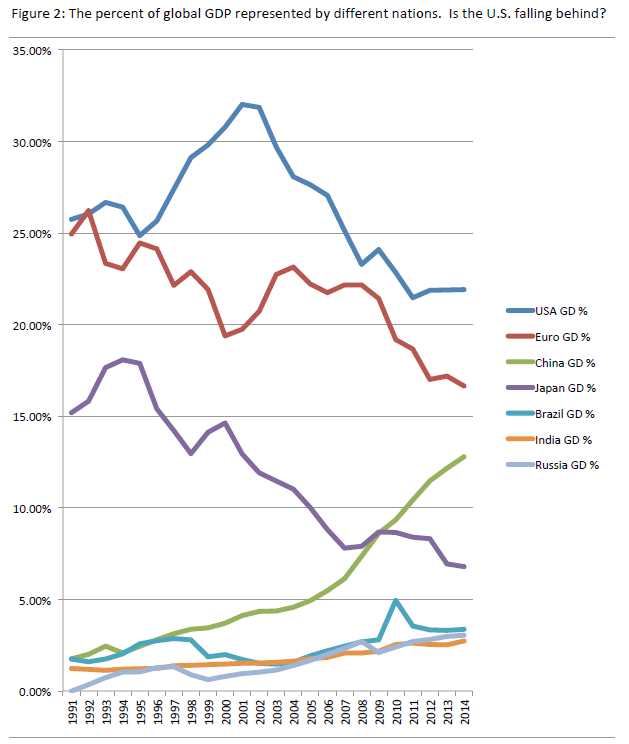
What you see there is that the U.S. is still in the lead by a pretty wide margin, and in recent years has actually stabilized its percentage of total global GDP. The decline has come mostly because a lot of smaller emerging markets, plus China and, to a certain extent, Brazil, India and Russia, have all been growing. At the same time, America’s traditional competitors—Europe and Japan—have been sinking. If you want to point a finger at decline, perhaps that’s a better direction than the U.S.

Does the U.S. face economic challenges? Of course. Is our political system a mess? Sure. Could things be better? Certainly. But if you sift through a lot of variables with a fine-toothed comb, you discover that the U.S. has created a better environment to grow and prosper than almost anywhere else, and it has held its own with the roaring growth of the emerging markets while the other developed nations are losing ground. More than a fifth of all economic activity still happens in the U.S., and the long, slow decline in that figure is not due to stagnation at home, but abundant growth all around the world. That’s not something to worry about; it’s something we should be celebrating.

If you would like to review your current investment portfolio or discuss any other financial planning matters, please don’t hesitate to contact us or visit our website at http://www.ydfs.com. We are a fee-only fiduciary financial planning firm that always puts your interests first.  If you are not a client yet, an initial consultation is complimentary and there is never any pressure or hidden sales pitch.

Sources:

http://reports.weforum.org/global-competitiveness-report-2014-2015/rankings/

http://www.economywatch.com/economic-statistics/year/1990/

http://theamericanscene.com/2008/05/07/a-post-american-world

TheMoneyGeek thanks guest writer Bob Veres for writing this post.