Market & Economic Summary for the Week Ended January 24, 2025

The shortened holiday trading week saw markets react positively to the presidential inauguration and a slew of policy decisions, lifting the S&P 500 Index by 1.7% to a new all-time closing high. The NASDAQ index closed up almost 1.6%, and the small-capitalization Russell 2000 index followed suit and closed up almost 1.4%.

While market technical data failed to make significant positive headway going into this coming week’s Federal Open Market Committee meeting, institutional selling (distribution) eased for the first time in several weeks.

Economic data was somewhat light this week.

Existing Home Sales from the National Association of Realtors for December rose 2.2% month over month and 9.3% year over year. Despite these seeming improvements, total sales for 2024 settled at the lowest level in almost 30 years. Existing Home Sales have bounced around a historically low range since late 2022 and continue to expose significant fissures in the housing market. Housing sector stocks remained buoyant for the week.

The Consumer Sentiment final reading for January surprised to the downside, dropping 4% from December’s reading. All components saw declines except for consumers’ assessments of personal finances. This broad-based pullback reflects concerns surrounding the current and future economy and inflation. Year-ahead inflation expectations soared to 3.3% this month, which does not bode well for the Fed’s battle to their 2% target.

The Conference Board’s Leading Economic Index (LEI) fell back in December. Despite strong contributions from financial inputs, the LEI failed to gain positive traction, as half of the ten components, including new orders and consumer expectations, were negative for the month. Thus, the leading economic data indicates that the path forward remains somewhat uncertain.

Sam H. Fawaz is the President of YDream Financial Services, Inc., a fee-only investment advisory and financial planning firm serving the entire United States. If you would like to review your current investment portfolio or discuss any other tax or financial planning matters, please don’t hesitate to contact us or visit our website at http://www.ydfs.com. We are a fiduciary financial planning firm that always puts your interests first, with no products to sell. If you are not a client, an initial consultation is complimentary, and there is never any pressure or hidden sales pitch. We start with a specific assessment of your personal situation. There is no rush and no cookie-cutter approach. Each client and their financial plan and investment objectives are different.

Source: InvesTech Research

Market & Economic Summary for the Week Ended January 17, 2025

Compared to the prior week, all seemed to be forgiven in the markets, as the S&P 500 index leaped 2.9% thanks to better-than-feared inflation data. The NASDAQ also sprinted up 2.9%, while the Small-Capitalization stocks led the way, vaulting almost 4.0%. January continues to live up to its reputation for increasing chop and volatility, while some signs of institutional selling continued.

The Consumer Price Index (CPI) for December came in at 2.9%, up from 2.7% in November. Core CPI (which excludes the more volatile categories of food and energy) was down from 3.3% to 3.2%, signaling that the rate of inflation is stubbornly stable and consumers are still feeling the pinch. Wall Street cheered this better than expected news as it continues to expect (hope?) at least two rate cuts in 2025.

The Producer Price Index (PPI), which tracks prices paid by businesses, was also up 3.3% year over year in December but lower than forecast. The vast majority of producer price increases resulted from energy costs.

The National Federation of Independent Businesses (NFIB) released its Small Business Optimism Index for December, which increased to its highest reading since July 2019. Small business owners are feeling more hopeful about the future, anticipating that potential favorable regulatory changes from the incoming administration will help Main Street.

Builder Confidence from the National Association of Home Builders (NAHB) edged up in December, as did Traffic of Prospective Buyers. However, sales expectations in the next six months fell six points. Price cuts and sales incentives continue to be offered as the cost of construction and high mortgage rates rise.

Housing Starts were up a surprising 15.8% in December, much of this due to an almost 60% increase in multi-family unit starts. This is an extremely volatile monthly number, and it’s worth noting that Housing Starts were still down 4.4% year-over-year. Additionally, Building Permits, which are generally more forward-looking and feed into future housing starts, were down 0.7% from November and down 3.1% compared to 2023.

YDream Financial Services is an investment advisory and financial planning firm serving the entire United States. If you would like to review your current investment portfolio or discuss any other financial planning matters, please don’t hesitate to contact us or visit our website at http://www.ydfs.com. We are a fee-only fiduciary financial planning firm that always puts your interests first. If you are not a client, an initial consultation is complimentary, and there is never any pressure or hidden sales pitch. We start with a specific assessment of your personal situation. There is no rush and no cookie-cutter approach. Each client and your financial plan and investment objectives are different.

Source: InvesTech Research

Market & Economic Summary for the Week Ended January 10, 2025

The S&P 500 index closed almost two percent lower after a fairly volatile, shortened trading week as investors grapple with uncertainty regarding future monetary policy and economic conditions. The NASDAQ index shed 2.2% while the small capitalization stocks slid 3.4% on the week, giving up their prior week‘s strength.

The post-election market “bump” we saw has all but been dissipated as institutional distribution (selling) continued this week, raising concerns of a more extended market correction.

Friday’s Employment Situation Summary (AKA the monthly jobs report) from the Bureau of Labor Statistics (BLS) for December surprised forecasts, coming in with 256K new jobs while the unemployment rate ticked down to 4.1%. Employment increases were seen in health care, retail, government, and social assistance. While a positive development, all but retail are non-cyclical sectors that are less sensitive to economic fluctuations. Stocks sold off and interest rates ticked up in response as the report reduces the possibility of additional rate cuts in 2025.

Job Openings from the BLS for November reported an increase to its highest level since May. Despite this, both the hiring and quits rate ticked down, suggesting that employers are hiring cautiously and that workers may feel less confident about finding new job opportunities.

The Institute for Supply Management’s (ISM) Services Sector rose in December, signaling continued expansion. However, a dramatic increase in the Prices Paid subcomponent is concerning, indicating that inflation pressures are becoming more pervasive. Despite improvements in most components, bond yields jumped higher and stocks sold off, proving that good economic news can sometimes elicit a bad market reaction.

A deeper look beneath the surface reveals why the situation may not be as encouraging as it seems. Many survey respondents cited end-of-year seasonal factors that boosted demand (perhaps to front-run potential tariffs.) Indeed, the main focus was tied to concerns about potential tariffs. This implies that the services sector could be weaker in the coming months if new policies are introduced.

Since September, the Federal Reserve has implemented several short-term interest rate cuts in an attempt to support economic growth. However, despite these efforts, longer-term bond yields have actually continued to climb (pressuring bond prices.) This suggests that some investors may be rejecting the idea that inflation has been tamed, which would likely limit the Fed’s ability to reduce rates further in the near term.

Friday’s preliminary January reading of Consumer Sentiment from the University of Michigan saw a fractional decrease from last month. However, the Current Conditions component improved while the Consumer Expectations component fell, reflecting concerns over future economic growth. Inflation uncertainty has climbed considerably over the past twelve months and year-ahead expectations soared in January, its highest reading since May 2024.

Sam H. Fawaz is the President of YDream Financial Services, Inc., a fee-only investment advisory and financial planning firm serving the entire United States. If you would like to review your current investment portfolio or discuss any other tax or financial planning matters, please don’t hesitate to contact us or visit our website at http://www.ydfs.com. We are a fee-only fiduciary financial planning firm that always puts your interests first with no products to sell. If you are not a client, an initial consultation is complimentary, and there is never any pressure or hidden sales pitch. We start with a specific assessment of your personal situation. There is no rush and no cookie-cutter approach. Each client and their financial plan and investment objectives are different.

Source: InvesTech Research

The Impact of Higher Interest Rates on Real Estate

At the beginning of March 2022, the U.S. 10-year Treasury Bill interest rate hovered around 1.8%. By January 2024, that same 10-year rate hovered around 4%, more than doubling in less than two years.

As a result, U.S. commercial real estate prices fell more than 11% between March 2022, when the Federal Reserve started hiking interest rates, and January 2024. The potential for steeper losses has chilled the market and still poses potentially significant risks to some property owners and lenders. (1)

On the residential side of the real estate market, the national median price of an existing home rose 5.7% over the year that ended in April 2024 to reach $407,600, a record high for April. (2) Despite sky-high borrowing costs, buyer demand (driven by younger generations forming new households) has exceeded the supply of homes for sale.

Here are some factors affecting these distinct markets and the broader economy.

Slow-motion Commercial Meltdown

The expansion of remote work and e-commerce (two byproducts of the pandemic) drastically reduced demand for office and retail space, especially in major metro areas. An estimated $1.2 trillion in commercial loans are maturing in 2024 and 2025, but depressed property values, high financing costs, and vacancy rates could make it difficult for owners to keep up with their debt. (3) In April 2024, an estimated $38 billion of office buildings were threatened by default, foreclosure, or distress, the highest amount since 2012. (4)

In a televised interview on CBS’ 60 Minutes in February, Federal Reserve Chairman Jerome Powell said the mounting losses in commercial real estate are a “sizable problem” that could take years to resolve, but the risks to the financial system appear to be manageable. (5)

Locked-up Housing Market

The average rate for a 30-year fixed interest rate mortgage climbed from around 3.2% in the beginning of 2022 to a 23-year high of nearly 8% in October 2023. Mortgage rates have dropped since then, but not as much as many hoped. In May 2024, the average rate hovered around 7%. (6)

The inventory of homes for sale has been extremely low since the pandemic, but a nationwide housing shortage has been in the works for decades. The 2005-2007 housing crash devastated the construction industry, and labor shortages, limited land, higher material costs, and local building restrictions have all been blamed for a long-term decline in new single-family home construction.  The Federal Home Loan Mortgage Corporation, better known as Freddie Mac, estimated the housing shortfall was 3.8 million units in 2021 (most recent data). (7)

Many homeowners have mortgages with ultra-low rates, making them reluctant to sell because they would have to finance their next homes at much higher rates. This “lock-in effect” has worsened the inventory shortage and cut deep into existing home sales. At the same time, the combination of higher mortgage rates and home prices has taken a serious toll on affordability and locked many aspiring first-time buyers out of homeownership.

In April 2024, home inventories were up 16% over the previous year, but there was still just a 3.5-month supply at the current sales pace (a market with a six-month supply is viewed as balanced between buyers and sellers, but see the Latest Housing Data below.) The supply of homes priced at more than $1 million was up 34% over the previous year, which may help affluent buyers but won’t do much to improve the affordability of entry-level homes. (8)

New Construction Kicking In

Newly built homes accounted for 33.4% of homes for sale in the first quarter of 2024, down from a peak of 34.5% in 2022 but still about double the pre-pandemic share. The growth in market share for new homes was mostly due to the lack of existing homes for sale. (9)

April 2024 was the second-highest month for total housing completions in 15 years, with 1.62 million units (measured annually), including single-family and multi-family homes. (10) This may cause apartment vacancies to trend higher, help slow rent growth, and allow more families to purchase brand-new homes in the next few months.

Renters are seeing some relief thanks to a glut of multi-family apartment projects that were started in 2021 and 2022 — back when interest rates were low — and are gradually becoming available. In the 1st quarter of 2024, the average apartment rent fell to $1,731, 1.8% below the peak in the summer of 2023. (11)

We don’t want to see a dramatic decline in new multi-family housing projects just as rents are starting to ease. Reducing housing inflation is essential to paving a path toward lower interest rates, but rents could rise again if the new supply drops significantly.

Effects Weave Through the Economy

By one estimate, the construction and management of commercial buildings contributed $2.5 trillion to U.S. gross domestic product (GDP), generated $881.4 billion in personal earnings, and supported 15 million jobs in 2023. (12) According to the National Association of Realtors, residential real estate contributed an estimated $4.9 trillion (or 18%) to U.S. GDP in 2023, with each median-priced home sale generating about $125,000. When a home is purchased (new or existing), it tends to increase housing-related expenditures such as appliances, furniture, home improvement, and landscaping. (13)

Both real estate industries employ many types of professionals, and developing new homes and buildings stimulates local economies by creating well-paying construction jobs and boosting property tax receipts. The development benefits other businesses (locally and nationally) by increasing production and employment in industries that provide raw materials like lumber or that manufacture or sell building tools, equipment, and components.

Shifts in real estate values, up or down, can influence consumer and business finances, confidence, and spending. And when buying a home seems unattainable, some younger consumers might give up on that goal and spend their money on other things.

If interest rates stay high for too long, they could accelerate commercial loan defaults, losses, and bank failures, continue to constrain home sales, or eventually push down home values—and any of these outcomes could potentially cut into economic growth. When the Federal Reserve finally begins to cut interest rates, borrowing costs should follow, but that’s not likely to happen until inflation is no longer viewed as the larger threat.

Latest Housing Data

The latest housing data shows we may have seen a cyclical high for the housing market.

For April, the S&P Case-Shiller 20-City House Price Index was up again, increasing by 0.4% on a seasonally adjusted basis, but below forecasts. While the Index is rising to new highs, home price growth is slowing.

May New Home Sales fell 11.3% from the previous month, and prices are now 9% below their October 2022 peak. The number of months’ supply of new homes for sale jumped, rising to 9.3 months, reflecting inventory levels only seen in some of the worst housing recessions of the last 50 years.

The housing market is starting to come back to earth. It is a major unknown how long it will take to normalize or how swift its fall. If new home sales data worsens and existing home supply increases further, prices will inevitably come down. We don’t want to see mounting evidence of a housing market plunge, which would majorly affect the broader economy.

If you would like to review your current investment portfolio or discuss any other retirement, tax, or financial planning matters, please don’t hesitate to contact us at 734-447-5305 or visit our website at http://www.ydfs.com. We are a fee-only fiduciary financial planning firm that always puts your interests first. If you are not a client, an initial consultation is complimentary, and there is never any pressure or hidden sales pitch. We start with a specific assessment of your personal situation. There is no rush and no cookie-cutter approach. Each client and your financial plan and investment objectives are different.

1, 3) International Monetary Fund, January 18, 2024

2, 8, 10, 13) National Association of Realtors, 2024

4) The Wall Street Journal, April 30, 2024

5) CBS News, February 4, 2024

6–7) Freddie Mac, 2022–2024

9) Redfin, May 20, 2024

11) Moody’s, April 1, 2024

12) NAIOP Commercial Real Estate Development Association, 2024

What Persistent Inflation Could Mean for the U.S. Economy

Economic reports of late seem to point to a weakening economy and stubborn inflation.

On April 30, the Employment Cost Index for the first calendar quarter of 2024 showed a 1.2% increase (4.2% year-over-year); that was 25% higher than the consensus estimate of 0.9%.

The FHFA House Price Index for February 2024 was much hotter than expected, coming in at 1.2% versus 0.1% expected (7.0% year-over-year.) Similarly, the February Case-Shiller 20-City Home Price Index came in at 0.6% versus 0.1% expected (7.3% year-over-year.)

At the same time, two more economic reports were released on April 30.

The Chicago Purchasing Managers’ Index (PMI) was 37.9 (versus 45 expected).

The Conference Board’s Consumer Confidence Index also came in far below expectations (97 versus 104 expected).

The stock markets were understandably confused: Normally, lower economic activity means lower inflation. Instead, what we got was higher inflation and lower economic activity.

In the stock markets, confusion equals selling now and asking questions later. That’s what we are seeing now.

Persistent Inflation

On April 10, 2024, the U.S. Bureau of Labor Statistics released the Consumer Price Index (CPI) for March, and the increase in CPI — the most commonly cited measure of inflation — was higher than expected. The rate for all items (headline inflation) was 3.5% over the previous year, while the “core CPI” rate, which strips out volatile food and energy prices, was even higher at 3.8%. The month-over-month change was also higher than anticipated at 0.4%. (1)

The stock market then dropped sharply on this news and continued to slide over the following days, while economists engaged in public handwringing over why their projections had been wrong and what the higher numbers might mean for the future path of interest rates. Most projections were off by just 0.1% — core CPI was expected to increase by 3.7% instead of 3.8% — which hardly seems earth-shattering to the casual observer. But this small difference suggested that inflation was proving more resistant to the Federal Reserve’s high interest-rate regimen (raising interest rates is one of the most common ways to curb spending and corporate investing to reduce inflationary pressures.) (2)

It’s important to remember that the most dangerous battle against inflation seems to have been won. CPI inflation peaked at 9.1% in June 2022, and there were fears of runaway inflation similar to the 1980s. That did not happen; inflation declined steadily through the end of 2023. The issue now is that there has been upward movement during the first three months of 2024.(3) This is best seen by looking at the monthly rates, which capture the current situation better than the 12-month rates. March 2024 was the third increase month that points to higher inflation (see chart).

High for longer

While price increases hit consumers directly in the pocketbook, the stock market reacted primarily to what stubborn inflation might mean for the benchmark federal funds rate and U.S. businesses. From March 2022 to July 2023, the Federal Open Market Committee (FOMC or AKA the Fed) raised the funds rate from near-zero to the current range of 5.25%–5.5% to slow the economy and hold back inflation.

At the end of 2023, with inflation moving firmly toward the Fed’s target of 2%, the FOMC projected three quarter-percentage point decreases in 2024, and some observers expected the first decrease might be this spring. Now it’s clear that the Fed will have to wait to reduce rates. (4)(5)

Higher interest rates make it more expensive for businesses and consumers to borrow. For businesses, this can hold back expansion and cut into profits when revenue is used to service debt. This is especially difficult for smaller companies, which often depend on debt to grow and sustain operations. Tech companies and banks are also sensitive to high rates. (6)

As mentioned above, in theory, high interest rates should hold back consumer spending and help reduce prices by suppressing demand. So far, however, consumer spending has remained strong. In March 2024, personal consumption expenditures — the standard measure of consumer spending — rose at an unusually strong monthly rate of 0.8% in current dollars or 0.5% when adjusted for inflation. (7)

The job market has also stayed strong, with unemployment below 4% for 26 consecutive months and wages rising steadily. (8)

The fear of keeping interest rates too high for too long is that it could slow the economy, but that is not the case, making it difficult for the Fed to justify rate cuts.

What’s driving inflation?

The Consumer Price Index measures price changes in a fixed market basket of goods and services, and some inputs are weighted more heavily than others.

The cost of shelter is the largest single category, accounting for about 36% of the index and almost 38% of the March increase in CPI. (9) The good news is that measurements of shelter costs — primarily actual rent and estimated rent that homeowners might receive if they rented their homes — tend to lag current price changes, and other measures suggest that rents are leveling or going down. (10)

Two lesser components contributed well above their weight. Gas prices, which are always volatile, comprised only 3.3% of the index but accounted for 15% of the overall increase in CPI. Motor vehicle insurance prices comprised just 2.5% of the index but accounted for more than 18% of the increase. Together, shelter, gasoline, and motor vehicle insurance drove 70% of March CPI inflation. On the positive side, food prices comprised 13.5% of the index and rose by only 0.1%, effectively reducing inflation. (11)

While the Fed pays close attention to the CPI, its preferred inflation measure is the personal consumption expenditures (PCE) price index, which places less emphasis on shelter costs, includes a broader range of inputs, and accounts for changes in consumer behavior. Due to these factors, PCE inflation tends to run lower than CPI. The annual increase in March was 2.7% for all items and 2.8% for core PCE, excluding food and energy. The monthly increase was 0.3% for both measures. (12)

Although these figures are closer to the Fed’s 2% target, they are not low enough, given strong employment and consumer spending, to suggest that the Fed will reduce interest rates anytime soon. It’s also unlikely that the Fed will raise rates.

The Fed seems poised to give current interest rates more time to push inflation to a healthy level, ideally without slowing economic activity. (13)

And since higher interest rates mean more competition for investment dollars and lower corporate earnings, stock markets don’t tend to react favorably, especially when 3-4 interest rate cuts were expected earlier this year.

The Fed issues its next interest rate decision on Wednesday afternoon, May 1, 2024. No change in interest rates is all but a given. However, what Federal Reserve Chairman Jerome Powell says about the recent economic data and the Fed’s stance on when future rate cuts are coming will no doubt be parsed word for word for clues when the press conference is convened.

Please pass the popcorn.

If you would like to review your current investment portfolio or discuss any other retirement, tax, or financial planning matters, please don’t hesitate to contact us at 734-447-5305 or visit our website at http://www.ydfs.com. We are a fee-only fiduciary financial planning firm that always puts your interests first. If you are not a client, an initial consultation is complimentary, and there is never any pressure or hidden sales pitch. We start with a specific assessment of your personal situation. There is no rush and no cookie-cutter approach. Each client and your financial plan and investment objectives are different.

Footnotes:

1, 3, 8–9, 11) U.S. Bureau of Labor Statistics, 2024

2)The New York Times, April 10, 2024

4) Federal Reserve, 2023

5) Forbes, December 5, 2023

6) The Wall Street Journal, April 15, 2024

7, 12) U.S. Bureau of Economic Analysis, 2024

10) NPR, April 18, 2024

13) Bloomberg, April 19, 2024

Is a Recession Looming?

With inflation falling, the housing market stabilizing, and consumer spending showing surprising resiliency in the face of rising interest rates, both Wall Street and Main Street are passionately embracing the outlook for an economic soft landing.

Despite enthusiastic buying in the stock market of late, some major recession warning flags have not disappeared, consumer financial stress is increasing, and the Federal Reserve has just increased short-term interest rates by another 0.25% to 5.25%, and signaled that they may not be done raising interest rates.

The question on everyone’s mind: is a recession looming?

To answer that question, with help and data from InvesTech Research, let’s look at both sides: the economic “soft-landing” camp and the “hard-landing” camp, and see if we can’t draw any conclusions using a weight-of-evidence approach.

Evidence Supporting a Soft Landing

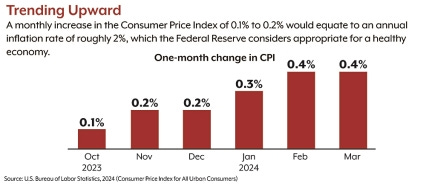
Inflation is Coming Down: The Consumer Price Index (CPI) is leading the optimistic charge in the media, with reports of decreasing inflation over the last twelve months. Headline CPI fell from 4.0% to 3.0% in June on a year-over-year basis. While much of this decline was driven by cyclical factors like energy costs, it still increases the odds of a soft landing.

Contributing to the decrease in overall prices are both the manufacturing and services sectors. The services sector saw inflationary pressures subside starting in early 2022. The Institute for Supply Management Services Prices Paid Index has declined by 30.4 points from its all-time high in December 2021. It has been down for the last seven out of eight months and remains in expansion territory (for now). This, too, supports a possible soft landing.

With decreasing inflation comes decreasing inflation psychology. Recently, consumers have reduced their expectations of inflation over the next year significantly. This measure fell in June to 3.3%, its largest decline since 2008, while the longer-term 5-year expectations remain more firmly anchored at 3.0%.

Actual inflation partially depends on what consumers expect it to be. If consumers expect inflation to be lower next year, businesses will plan to price their goods or services accordingly. It’s likely that the expected inflation rate will continue its downtrend and make a soft landing more likely.

Parts of the economy remain surprisingly resilient: In addition to easing inflation pressures, persistent strength in parts of the economy also supports a potential soft landing. Specifically, the service sector appears to remain resilient.

Services: The Institute for Supply Management Services Index (Non-Manufacturing) remains solidly in expansion territory with a reading of 53.9 last month (any reading above 50 is considered expansionary) and only one month of contraction in the last decade (outside of the pandemic). With services accounting for over 75% of U.S. gross domestic product (GDP), the current Index levels show continued growth. While there is no guarantee this will be maintained, its recent strength provides recession-free hope.

Labor: The relentlessly tight labor market has remained a stronghold of the economy for the last few years. June’s Non-Farm Payrolls report showed 209,000 new jobs created, another banner month for this indicator. The monthly average of new jobs added since January 2022 is almost twice as high as it was during the same period in 2018-2019 prior to the pandemic. In addition, the unemployment rate is currently at 3.6%, just fractionally above its 50-year low. With job growth holding up so well, it doesn’t point to a recession, despite being a heavily revised figure.

Housing: The last bit of soft-landing evidence is one of its strongest – New Home Sales. Sales of new construction have rebounded sharply. New homes currently account for a near-record 29% of all homes for sale, while the historical average is less than half that at just 13%. This recent rebound is driven by a resurgence in enthusiastic buyer psychology, reflected in a rise in traffic of prospective buyers and a reluctance by existing homeowners to sell their homes because of: 1) their current ultra-low mortgage interest rates, 2) higher home replacement costs and 3) potential capital gains taxes on highly appreciated primary residences. Whether this increase is sustainable will be clearer in the coming months.

Evidence Supporting a Hard Landing

A recession may nonetheless be in the cards: While I’ve laid out the evidence in support of a soft landing, many significant indicators just don’t add up, and therefore a recession may still be in the cards.

Leading Economic Index (LEI): The most glaring evidence against a soft landing is the Conference Board’s LEI, which has fallen for 15 consecutive months. Declines of this magnitude have always corresponded to a hard landing, and when the LEI falls below its 18-month moving average, a recession almost invariably follows. Additionally, the LEI’s 6-month rate of change (ROC) is deeply negative, further solidifying this warning flag (red flags are when the 6-month ROC breaks through the zero level prior to a recession). The LEI is historically a reliable indicator, and it is not sending an optimistic signal.

Yield Spreads: Another indicator that is screaming hard landing is the Federal Reserve’s Yield Spread model, which measures the risk of recession in the next 12 months. It’s based on the difference between long-term and short-term Treasury bond yields and recently hit a 42-year high of 71% before retreating slightly to 67% in June. This highly dependable indicator has never reached this level without a resulting recession, although lead times can vary significantly.

Consumer Spending: Lastly, consumer spending has supported the economy for much of the last few years, bolstered by trillions of dollars in stimulus payments and other benefits. Excess savings and lockdowns have helped fuel this strength, though it may be starting to slow.

Within retail sales, “Same-Store Sales” measures growth in revenue from existing (not new) store locations.  Johnson Redbook’s latest Same-Store Sales year-over-year figure went negative, indicating fewer purchases compared to a year ago. If this continues to deteriorate, it implies consumers are spending less overall than before, and a recession becomes more probable.

The Federal Reserve’s (a.k.a. The Fed) job is far from over: A potential soft landing combined with some weak economic indicators is a conundrum that puts the Fed in a tight spot. In addition, while headed in the right direction, inflation is still well above the Fed’s 2% target.

Sticky inflation, which tracks items that change in price very slowly, has not come down as rapidly as overall measures. Sticky Price CPI from the Atlanta Fed has started to decline on a 12-month ROC basis but is still quite elevated, with the current reading at 5.8%.

The shorter, 3-month annualized ROC is much lower but still not close enough to the Fed’s target. It’s very likely that Sticky CPI will continue to decline, but the elusive 2.0% will take much longer to reach than the Fed would like.

Core PCE: Yet another, perhaps more important, inflation indicator is the Core Personal Consumption Expenditures (PCE) Price Index, which measures PCE excluding food and energy. This is the Fed’s preferred measure of inflation and remains at more than twice of the 2.0% inflation target. On Friday, the latest PCE measure came in at 4.1% YoY for June, declining from 4.6% in May.

Making the situation even worse, Core PCE has been flat for the past year and is falling very slowly. Even if it does start to trend lower, it will take quite a long time to reach the target level, putting pressure on the Fed to keep interest rates higher for longer.

Wage Growth: When it comes to inflation, one of the stickiest components is wage growth. The labor market remains tight, there are still more job openings than available employees, and wages continue to rise. The Atlanta Fed’s Wage Growth Tracker is off its all-time high, but at 5.6%, it is still far above its historical average. While increasing wages are beneficial for consumers, it’s a problem for the Fed as failure to control wage growth could risk another inflation surge.

Consumer Distress as a Potential Systemic Risk: Consumers amassed over $2 trillion in excess savings after the pandemic, primarily due to government support and lockdowns. This backlog of cash has helped smooth over many underlying problems in the economy.  After lockdowns ended, consumers spent as if they had unlimited funds. Tack on a decades-high level of inflation, and they’ve now burned through over 80% of their excess savings. Based on current trends, these savings will be completely exhausted by the end of this year. Once savings are depleted, some consumers will likely resort to what is now very expensive revolving debt.

And some already have. Despite the amassed excess savings in some households, consumers still took on more debt than ever after the pandemic. As a result, the combination of auto loans, credit card debt, student loans, and other debt is now at a record high – 72% higher than during the Great Financial Crisis.

Regarding student loan debt, the Consumer Financial Protection Bureau reported that half of borrowers whose payments are scheduled to restart soon have other debts that are at least 10% more expensive now than before the pandemic. If these trends persist, consumers may struggle to bring their savings back to pre-pandemic levels.

Those who have opened new credit cards in recent years or regularly carry credit card debt are quickly coming under more severe financial stress. Monetary tightening has driven average credit card interest rates to over 22% in May – the highest rate since the Federal Reserve began tracking the data in late 1994. Extremely high credit card interest rates combined with record consumer debt outstanding could prove to be an ominous combination.

Consumer spending is the ultimate driver of the economy, making up almost 70% of GDP. If consumers can no longer afford to spend, this systemic risk can become a reality.

The Weight of Evidence

While the evidence is compelling in both the economic soft-landing and the hard-landing camps, more upcoming near-term economic data will help tip the scale solidly into one of the camps.

While it’s easy to say that a recession is inevitable, one could make that statement anytime during our lifetimes. Indeed, it’s not a matter of whether we’ll have a recession because we will. It’s all about the “when” of the recession.

In my opinion, the weight of current evidence supports a recession starting within six months. To be honest, I personally thought we were already in a recession, but the economic data has not supported that opinion, which means I have been wrong so far.

Regardless, a continued deterioration in consumer spending, increasing debt levels, growing layoffs, and higher short-term interest rates will have a detrimental impact on consumer confidence, which constitutes a negative feedback loop that will lead to even further reduced consumer spending and increasing layoffs.

The next few months will be very revealing…. if not exciting!

If you would like to review your current investment portfolio or discuss any other financial planning matters, please don’t hesitate to contact us or visit our website at http://www.ydfs.com. We are a fee-only fiduciary financial planning firm that always puts your interests first.  If you are not a client, an initial consultation is complimentary and there is never any pressure or hidden sales pitch. We start with a specific assessment of your personal situation. There is no rush and no cookie-cutter approach. Each client is different, and so are your financial plan and investment objectives.

Source: Investech Research