Evidence for Time Diversification

One area where many professional advisors disagree with academics is whether stock investments tend to become less risky as you go out in time. Advisors say that the longer you hold stocks, the more the ups and downs tend to cancel each other out, so you end up with a smaller band of outcomes than you get in any one, two or five year period. Academics beg to disagree. They have argued that, just as it is possible to flip a coin and get 20 consecutive “heads” or “tails,” so too can an unlucky investor get a 20-year sequence of returns that crams together a series of difficult years into one unending parade of losses, something like 1917 (-18.62%), 2000 (-9.1%), 1907 (-24.21%), 2008 (-37.22%), 1876 (-14.15%), 1941 (-9.09%), 1974 (-26.95%), 1946 (-12.05%), 2002 (-22.27%), 1931 (-44.20%), 1940 (-8.91%), 1884 (-12.32%), 1920 (-13.95%), 1973 (-15.03%), 1903 (-17.09%), 1966 (-10.36%), 1930 (-22.72%), 2001 (-11.98%), 1893 (-18.79%), and 1957 (-9.30%).

Based purely on U.S. data, the professional advisors seem to be getting the better of the debate, as you can see in the below chart, which shows rolling returns from 1973 through mid-2009.

dd342ee2-d38b-40ef-b622-583f11f0b02c

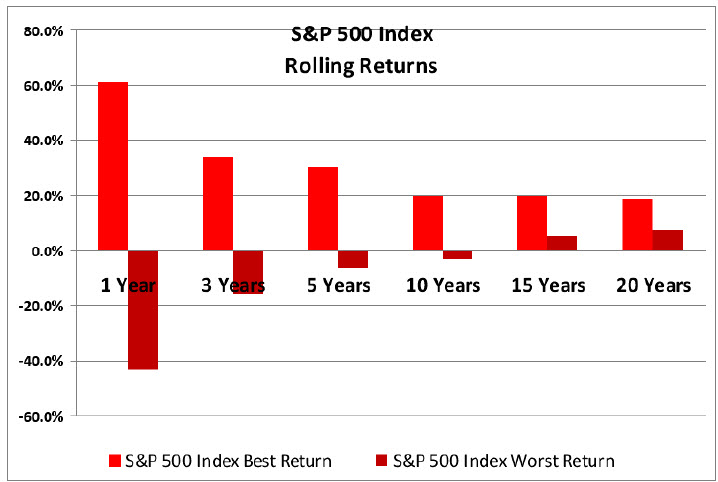
The outcomes in any one year have been frighteningly hard to predict, ranging anywhere from a 60% gain to a 40% loss. But if you hold that stock portfolio for three years, the best and worst are less dramatic than the best and worst returns over one year, and the returns are flattening out gradually over 10, 15 and 20 years. No 20-year time period in this study showed a negative annual rate of return.

But this is a fairly limited data set. What happens if you look at other countries and extend this research over longer time periods? This is exactly what David Blanchett at Morningstar, Michael Finke at Texas Tech University and Wade Pfau at the American College did in a new paper, as yet unpublished, which you can find here:
http://papers.ssrn.com/sol3/papers.cfm?abstract_id=2320828.

The authors examined real (inflation-adjusted) historical return patterns for stocks, bonds and cash in 20 industrialized countries, each over a 113-year time period. The sample size thus represents 2,260 return years, and the authors parsed the data by individual time periods and a variety of rolling time periods, which certainly expands the sample size beyond 87 years of U.S. market behavior.

What did they find? Looking at investors with different propensities for risk, they found that in general, people experienced less risk holding more stocks over longer time periods. The only exceptions were short periods of time for investors in Italy and Australia. The effect of time-dampened returns was particularly robust in the United Kingdom, Japan, Denmark, Austria, New Zealand, South Africa and the U.S.

Overall, the authors found that a timid investor with a long-term time horizon should increase his/her equity allocation by about 2.7% for each year of that time horizon, from whatever the optimal allocation would have been for one year. The adventurous investor with low risk aversion should raise equity allocation by 1.3% a year. If that sounds backwards, consider that the timid investor started out with a much lower stock allocation than the dare-devil investor–what the authors call the “intercept” of the Y axis where the slope begins.

Does that mean that returns in the future are guaranteed to follow this pattern? Of course not. But there seems to be some mechanism that brings security prices back to some kind of “normal” long-term return. It could be explained by the fact that investors tend to be more risk-averse when valuations (represented by the P/E ratios) are most attractive (when stocks, in other words, are on sale, but investors are smarting from recent market losses), and most tolerant of risk during the later stages of bull markets (when people are sitting on significant gains). In other words, market sentiment seems to view the future opportunity backwards.

Is it possible that stocks are not really fairly priced at all times, but instead are constantly fluctuating above and below some hard-to-discern “true” or “intrinsic” value, which is rising far more steadily below the waves? That underlying growth would represent the long-term geometric investment return, more or less–or, at least, it might have a relationship with it that is not well-explored. The old saw that stocks eventually return to their real values, that the market, long-term, is a weighing machine, might be valid after all.

If you have any questions about financial or investment planning and management, please don’t hesitate to contact us or visit our website at http://www.ydfs.com. We are a fee-only fiduciary financial planning firm that always puts your interests first.

What, We Worry?

So far this year, the investment markets have held up pretty well, which doesn’t always happen after a year of big returns like we experienced in 2013.  But based on experience, you know that something will spook investors at some point this year, the way the markets took a dive when Congress decided to choke off the U.S. federal budget, or when investors realized that Greece had somehow managed to borrow ten times more than it could possibly pay back to its bondholders.

Professional investors have learned to create a mental “watch list” of possible market-shaking events, and they were helped recently when Noriel Roubini, chairman of Roubini Global Economics, former Senior Economist for International Affairs at the U.S. Council of Economic Advisors, compiled his own worry list.  Roubini said that we’re past the time when people should be fearful of a breakup of the Eurozone, or (for now) any Congressional tinkering with the debt ceiling.  The public debt crisis in Japan seems to be fading in the optimism of Japanese Prime Minister Shinzo Abe’s monetary easing and fiscal expansion, and the war between Israel and Iran over Iranian nuclear technology, once thought to be imminent, now appears to be on the back burner.

So what does today’s worry list look like?  Roubini starts off with China, which is trying to shift its growth away from exports toward private consumption.  Chinese leaders, he says, tend to panic whenever China’s economic growth slows toward 7% a year, at which time they throw more money at capital investment and infrastructure, creating more bad assets, a lot of industrial capacity that nobody can use, and a bunch of commercial and industrial buildings which sit empty along the skyline.  By the end of next year, something will have to be done about the growing debt at the same time that investors face a potential crash in inflated real estate prices.  Think: five or six 2008 real estate crises piled on top of each other, all of it happening in one country.

Numbers two and three on Roubini’s worry list involve the U.S. Federal Reserve, which could (worry #2) cease its massive purchases of real estate mortgages and government bonds too quickly, causing interest rates to rise and sending financial shockwaves around the world.  Or, on the other hand (worry #3) the Fed might keep rates low for so long that the U.S. experiences new bubbles in real estate, stocks and credit–and then experiences the consequences when the bubbles burst.

Roubini also worries about emerging market nations being able to manage their debt and capital inflows if interest rates go up, and of course the situation in the Ukraine has significant market-spooking potential.  Finally, he notes that China has significant unresolved territorial disputes with Japan, Vietnam and the Philippines, which could escalate into military conflict.  If the U.S. were drawn into a maritime confrontation, alongside Japan, with Chinese warships, investors might think it’s a good time to retreat to the sidelines.

None of these scenarios are guaranteed to happen, and some of them seem unlikely.  But these periodic, headline-related spookings come with the investment territory.  If and when one of these events grabs the global headlines, it might be helpful to remember that the stock markets have weathered far worse and have always come out ahead.  Think: World War II, a presidential assassination, two wars in the Middle East, 9/11 and a Wall Street-created global economic meltdown.  If we can survive and even profit, long-term, from a stay-the-course investment mentality through those events, then we might be able to weather the next big headline on (or off) the worry list.

If you have any financial planning questions you would like to discuss, please don’t hesitate to contact us at (734) 447-5305 or visit our website athttp://www.ydfs.com. We are a fee-only fiduciary financial planning and money management firm that always puts your interests first. Our first consultation is complimentary and free of any pressure or sales pitches.

Enjoy your weekend,
Sam

Sam H. Fawaz CPA, CFP
YDream Financial Services

Source:
http://www.project-syndicate.org/commentary/nouriel-roubini-warns-that-even-as-many-threats-to-the-world-economy-have-receded–new-ones-have-quickly-emerged#TA08zJsftAXboy7Y.99

Using Options To Enhance Portfolio Returns

When people think or hear about using options in their investment portfolios, they tend to think of them as risky instruments that lose their entire value, or worse, cause them to lose multiples of their value. But when used correctly, options can be a powerful tool to help enhance portfolio income, reduce overall portfolio risk, and make risk-defined bets on a stock, sector or fund.

What’s an Option

An option is a financial instrument, tied to or based on an individual stock or exchange traded fund, which gives the purchaser the right, but not the obligation, to buy or sell an underlying stock or fund. Options are unique in that they have a defined price to buy or sell the shares and a limited time to do so.  If you don’t “exercise” your right to buy or sell the shares within the time limit, whatever you pay for the option expires and is lost.

Options are sold as “contracts” for 100 shares each.  Remember, with options, you’re buying the right to buy or sell shares, not the shares themselves

There are two basic kinds of options: calls and puts. Let’s talk about each.

Calls and Puts

Think of calls as options to buy a stock or fund at a certain price. I liken a call to an option to buy a home at a certain price for a defined amount of time.

Let’s say that you’re interested in buying a home for $250,000 but aren’t sure that you can get the financing or whether the house is really worth the asking price. So you might offer the seller a sum of money to hold and sell you the house for $250,000 within 90 days. You might pay him a $2,500 “premium” for that option while you investigate financing or determine the true value of the home. During that time, the seller can’t offer to sell the home to anyone else.

If you can’t secure the financing, or you find out that the house is worth far less than $250,000, then you walk away having spent $2,500 for that right (but not the obligation) for 90 days to buy the home. If the true value of the home turns out to be $200,000, you just saved yourself $50,000 less the cost of the option (or $47,500).  If the value of the home instead turns out to be $300,000, then the seller is still obligated to sell you the house for $250,000. In that case, you would exercise your option and you just made an unrealized profit of $47,500 ($300,000 less $250,000 less the cost of the option or $2,500).

Think of puts as an option to sell a stock or fund at a certain price. In many ways, a put is akin to an insurance policy.

Let’s say that house that you just bought for $250,000 is insured for $250,000 and then burns down for a total loss. In that event, the insurance company would pay you for your loss as you “put” the (burned down) house to them. But in order to do that, you had to pay the insurance company an annual insurance premium of say $2,000. If nothing happens to the home, that premium paid is lost forever.

A Stock Example

Let’s turn the discussion to call options on stocks.

Say that you own 100 shares of Apple common stock currently trading for $500, which you bought for $400 per share and you want to generate additional income on those shares (besides the corporate dividend). To do so, you can sell a call option giving someone the right to “call away” your shares for a per share price of $550 within 45 days. For that sale, someone might pay you $1,000 (you don’t ever know who that someone is, but there’s always a willing buyer at the option exchanges for the right price). Note that there are many prices (called strike prices) that you can choose from to decide where you want to part with your Apple shares.

In this example, if Apple shares move down or never exceed $550 per share by the time the option expires, the buyer of that option will walk away without buying the shares and will be out $1,000, but you’ll be $1,000 richer. In that case, you keep your Apple shares and then repeat the process at a new appropriate sales price. Remember, if the buyer of the option can buy shares on the open market for less than $550, she has no reason to exercise that option.

If, on the other hand, Apple shares are at $575 by expiration, you’ll have to part with your shares for a price of $550 (plus the $1,000 that you pocketed for selling the option). The buyer of the option the exercises her option and then owns the shares and any appreciation over $550. You just made $150 per share profit plus the $1,000 option premium. You can then choose to buy new shares of Apple and repeat the process at a higher option price.  Note that the option buyer can call away the shares any time before they expire, but won’t do so unless the price of the shares is higher than $550.

Of course, with any option, you’re free to be the buyer of the calls to speculate on the price of any stock or fund. In the Apple example above, you could have been the buyer of the call option instead of being the seller and thereby speculate on the price of Apple appreciating.

So what about put options on a stock?

Lets continue the Apple example above. At $500 market value per share, you currently have $100 of unrealized profit per share. Now suppose you’ve become worried about a short-term decline in the overall market or in the price of Apple shares, but you don’t want to sell them yet.  Just in case, you might want a short-term insurance policy in the event that Apple shares tumble. In this case, you might buy a $500 put option for $1,000 to give you the right to “put” those shares to someone else for no less than $500 each.

So if Apple shares drop to $450, you’ll still get $500 for your shares when you exercise your put and the seller of the put will be out $4,000 ($500 minus $450 times 100 shares less $1,000 premium received). However, if the shares of Apple are trading for more than $500 by the expiration of the put option, then the put expires worthless and you’re out $1,000 and the seller pockets $1,000.

Safe Ways To Use Options

By now you may have realized that selling options is a nice way to make some extra income. When you consider that most options expire worthless, it is indeed better to be the “house” selling the options rather than the “bettor” buying the options.

The above examples are greatly simplified to help you with the understanding of options. We’ve left out all the mechanics and nuances of option trading to aid in understanding.

The reason that options get such a bad rap is because most people are buyers of options rather than sellers, and they usually buy far too many of them. Since each option contract is good for 100 shares, you shouldn’t buy or sell more contracts than you would buy or sell an equivalent number of shares of stock. Some people even sell calls on stocks that they don’t own (this is allowed), not realizing that stocks can sometimes go much higher than they can imagine. So if you sell an option “naked”, to a certain extent, you’re taking nearly unlimited risk.

In our client portfolios, we may generate income by selling calls against shares we own, so we only have the risk of the stock being called away. We may also hedge our portfolios with options to take advantage of short-term volatility. We may do so by trading puts, but do so in a risk defined way to minimize our premium outlay or maximize our premium generation. In other words, we don’t take unnecessary unlimited risk bets with options and use them only in the safest ways possible.

Hopefully this post helps you to better understand how we (and you could) use options in your own investment portfolios. Of course, if you want to dabble in options, I highly recommend that you get yourself a good book on options and study it carefully before trying them out. Option investing is where a little bit of knowledge is helpful, but can also be dangerous if you’re not sure what you’re doing.

If you’d like to know more about what we do to enhance and hedge investment portfolios, please don’t hesitate to contact us or just ask any questions.

Market Correction?

Last Monday, the U.S. markets dropped roughly 1% of their value (as measured by the S&P 500 index), and Europe and Asia were down by similar amounts the following day. The market then fell 2.1% on Friday in a sickening lurch. Today the S&P 500 fell another 0.5%. This combination was enough to cause pundits and investors to ask whether we are now in the early stages of a bear market or, indeed, if the past almost-five years should be considered an interim market rally inside of a longer-term bear market.

The answer, of course, is that nobody knows–not the brainiac Fed economists, not the fund managers and certainly not the pundits. A Wall Street Journal article noted that most of the sellers on Friday were short-term investors who were involved in program trading, selling baskets of stocks to protect themselves from short-term losses. Roughly translated, that means that a bunch of professional traders panicked when they learned that Chinese economic growth is slowing down on top of worries that the Fed is buying bonds at a somewhat less furious rate ($75 billion a month vs. $85 billion) than it was last year.

What we DO know is that it is often a mistake to panic sell into market downturns, which happen more frequently than most of us realize. A lot of people might be surprised to know that in the Summer of 2011, the markets had pulled back by almost 20%–twice the traditional definition of a market correction–only to come roaring back and reward patient investors. There were corrections in the Spring of 2010 (16%) and the Spring of 2012 (10%), but almost nobody remembers these sizable bumps on the way to new market highs. Indeed, most of us look back fondly at the time since March of 2009 as one long largely-uninterrupted bull market.

Bigger picture, since 1945, the market has experienced 27 corrections of 10% or more, and 12 bear markets where U.S. equities lost at least 20% of their value. The average decline was 13.3% over the course of 71 trading days. Perhaps the only statistic that really matters is that after every one of these pullbacks, the markets returned to record new highs. The turnarounds were always an unexpected surprise to most investors.

We may get a full 10% correction or even a full bearish period out of these negative trading days, and then again we may not. But history suggests an important lesson: if we DO get a correction or a bear market, we may not remember it a few years later if the markets recover as they always have in the past. The people who lose money in the long term are not those who endure a painful market downturn, but those who panic and sell when the market turns down. The facts are that the market is overdue for a reasonable correction after the torrid and virtually uninterrupted run up we’ve had since late 2012.

Instead of panic selling into the market downturn, you may choose to lighten up your equity weighting or re-balance some of your equity weight into other asset classes. After a long winning run, it never hurts to take some profits off the table, trim back your winners and leave the proceeds in cash to invest when the downturn ends. There are various inverse funds and other options available to partially hedge your portfolio if the uncertainty keeps you up at night. After a few days of selling, there’s usually a rally around the corner to counterbalance the weight of the selling and that’s a more opportune time to lighten up. None of this is a recommendation–they’re just some ideas to consider.

For our clients, we have raised and maintained a healthy level of cash and have used hedging to reduce our overall portfolio risk. If the correction becomes prolonged, we’ll do more of the same and await the next opportunities to re-invest. No one says that you have to stay 100% invested at all times.

If you have any questions or would like to speak to us about your portfolio needs or any financial planning matters, we’re here to help. We are a fee-only financial planning firm that always puts your interests first.

Fee-Only Financial Advisers Who Aren’t

Today’s (Saturday September 21, 2013) Wall Street Journal contains an article entitled ” ‘Fee-Only’ Financial Advisers Who Don’t Charge Fees Alone” written by award-winning writer Jason Zweig, better known as “The Intelligent Investor.” Jason acts as beacon to guide investors towards the better practices of saving and investing and warns them of the tricks and traps.

In this article, Jason points out that “You might think a “fee-only” financial adviser will never charge you commissions or other sales charges that could induce him to favor selling you something that is better for him than for you. Think again.”

Through his research, he found that many advisors who hold themselves out as “fee-only” indeed earn commissions, kickbacks, trails or other hidden compensation even though they might not sell you a product that generates one. He found that numerous advisors (661) that were Certified Financial Planners (TM) and worked for large Wall Street brokerage firms such as Morgan Stanley, UBS, RBC, Wells Fargo, J.P. Morgan Chase, Bank of America Merrill Lynch, Raymond James and Ameriprise Financial also listed themselves as fee-only advisors on the CFP (r) website. By definition, based on the nature of the firms that they work for, they cannot designate themselves as fee-only advisors or planners.

Many people also confuse fee-only with fee-based. They are definitely not the same. Fee-based means that the advisor can earn both fees for services as well as other commissions or kickbacks for selling investment, insurance or other financial products.

NAPFA, the National Association of Personal Financial Advisors (the de facto fee-only organization of planners and advisors found at napfa.org), the Financial Planning Association and the Certified Financial Planner board of standards are currently working on more clearly defining the “fee-only” standard and urging members to update their profiles and re-assert that they meet the more clearly-defined standard. I applaud this effort.

I wish to reassure our clients, prospects and friends that our firm, YDream Financial Services, takes a very serious and crystal clear stance on meeting the fee-only definition. Fee-only planners, like us, are compensated solely by fees paid by our clients and we do not accept commissions or compensation of any kind from any source. We also don’t earn any money or consideration from trails, referrals or markups. We have zero incentive to recommend any financial products and don’t accept anything (except perhaps trinkets from wholesalers or fund companies worth $5 or less handed out at conferences) that influences our recommendations. Our custodian, Charles Schwab does not reimburse or compensate us for any trade commissions or for the use of any particular financial products that they offer.

As a fiduciary, we take our responsibility to put your interests first and we endeavor do that in every recommendation or transaction that we initiate on your behalf. Finally, any conflicts of interest that our compensation approach might present are clearly discussed and disclosed with our clients and prospects prior to implementing the recommendation or moving forward with the engagement.

You can find the Wall Street Journal Article here http://goo.gl/23Oy3B. It’s worth the short read. If the link requires a log in or subscription to the Wall Street Journal Online, I suggest typing the title of the article above into your favorite search engine then click on the search hit that it finds.

Your Returns Versus the Market

One of the most misleading statistics in the financial world is the return data we are routinely given by the financial media, telling us how much investors made in the markets and in individual stocks or mutual funds over some time period.  In fact, your returns are almost guaranteed to be different from whatever the markets and the funds you’ve invested in have gotten.

How is this possible?  Start with cash flows.  We are told that the S&P 500 has delivered a compounded return of about 7.8% from 1992 through 2011, which sounds pretty positive until you realize that this return would only be available to somebody who invested all his or her money at the beginning of 1992 and didn’t move that money around at all for the next twenty years.  If you invested systematically, the same amount every month, as most of us do, then you would have earned a 3.2% compounded return.  Why?  A lot of your money would have been exposed to the 2008 downturn, and not much of it would have enjoyed the dramatic run-up in stocks from 1992 to 2000.

In addition, there is the difference–only now getting attention from analysts–between investor returns and investment returns.  Human nature drives investors to sell their stocks and move to the sidelines after their portfolios have been hammered–which is often the worst possible time to sell.  And it drives people to start increasing their equity allocations toward the peak of bull markets when they perceive that everybody else is getting rich.  That means less of their money tends to be exposed to stocks when the market turns from bearish to bullish, and more is exposed when markets switch from bullish to bearish.

Understand also that owning a diversified portfolio means that only a portion of your investments are exposed to stocks. Assets such as cash, bonds, real estate, commodities and other non-stock investments all have returns that are inherently different than stocks, making overall portfolio return comparisons an “apples to oranges” one.

This would be bad enough, but people also switch their mutual fund and stock holdings.  When a great fund hits a rough patch, there’s a tendency to sell that dog and buy a fund that whose recent returns have been scorching hot.  Many times the underperforming fund will reverse course, while the hot fund will cool off.  The Morningstar organization now calculates, for every fund it follows, the difference between the returns of the mutual fund and the average returns of the investors in fund, and the differences can be astonishing.  Overall, according to Morningstar statistics and an annual report compiled by the Dalbar organization, investor returns have historically been about half of what the markets and funds are reporting.

And then there’s the tax bite.  Some mutual funds invest more tax-efficiently than others, and generate less ordinary income.  Beyond that, if a fund is sitting on significant losses when you invest, you get to ride out its gains without having the tax impact distributed to your 1040.  If the fund is sitting on large gains when you buy in, you could find yourself paying taxes on gains even if the fund loses money.

Sources:

http://www.forbes.com/sites/financialfinesse/2012/06/20/why-your-investment-returns-could-be-lower-than-you-think/

http://www.thesunsfinancialdiary.com/investing/understanding-ms-total-return-and-investor-return/

http://corporate.morningstar.com/cf/documents/MethodologyDocuments/FactSheets/InvestorReturns.pdf

My thanks to Inside Information publisher Bob Veres for his contribution to this post.

The Rollercoaster Effect

There are two kinds of investor in this world.  One type pays close attention to the daily (and sometimes hourly) flood of information, looking for a reason (any reason) to jump in or out of the markets.  The other kind of investor is in for the long haul, and recognizes that the markets are going to experience dips and turns.  If these people are particularly wise, they know that the dips and turns are the best friend of the steady, long-term investor, because as you put money into the markets, as you re-balance your portfolio, you gain a little extra return from the occasional opportunities to buy at bargain prices.

Last week, the investment markets made an unusually sharp turn on the roller coaster, and showed us once again the sometimes-comical fallacy of quick trading.  See if you can follow the logic of the events that led to last week’s selloff.  Federal Reserve Board Chairman Ben Bernanke and the Federal Open Market Committee issued a statement saying that the U.S. economy is improving faster than the Fed’s economists expected.  Therefore (the statement went on to say) if there was continued improvement, the Fed would scale back its QE3 (quantitative easing) program of buying Treasury and mortgage-backed securities on the open market, and ease back on stimulating the economy and keeping interest rates low.

Everybody knows that the Fed will eventually have to phase out its QE3 market interventions, and that this would be based on the strength of the economy, so this announcement should not have stunned the investing public.  Nothing in the statement suggested that the Fed had any immediate plans to stop buying altogether; only ease it back as it became less necessary.  The statement said that this hypothetical easing might possibly take place as early as this Fall, and only if the unemployment rate falls faster than expected.  At the same time, the Fed’s economists issued an economic forecast that was more optimistic than the previous one.

The result?  There was panic in the streets–or, at least, on Wall Street, where this bullish economic report seems to have caused the S&P 500 to lose 1.4% of its valueon Wednesday and another 2.5% on Thursday.

In addition–and here’s where it gets a little weird–stocks also fell sharply in Shanghai and across Europe, and oil futures fell dramatically.  How, exactly, are these investments impacted by QE3?

The only explanation for last week’s panic selloff is that thousands of media junkie investors must have listened to “we plan to ease back on QE3 when we believe the economy is back on its feet again,” and heard: “the Fed is about to end its QE3 stimulus!”

It’s possible that the investors who sold everything they owned on Wednesday  throughFriday will pile back in this week, but it’s just as likely that the panic will feed on itself for a while until sanity is restored.  If stocks were valued daily based on pure logic, on the real underlying value of the enterprises they represent, then the trajectory of the markets would be a long smooth upward slope for decades, as businesses, in aggregate, expanded, moved into new markets, and slowly, over time, boosted sales and profits.  The roller-coaster effect that we actually experience is created by the emotions of the market participants, who value their stocks at one price on Wednesday, and very different prices on Thursday and Friday.

The long-term investor has to ask: did any individual company in my investment portfolio become suddenly less valuable in two days?  Did ALL of their enterprise values in aggregate become less valuable within 48 hours–and at the same time, did Chinese and European stocks and oil also suddenly become less valuable?  Phrased this way, the only possible answer is: no.  And if that’s your answer, then you have to assume that eventually, people will eventually be willing to pay the real underlying value of the stocks in the market, and the last couple of days will be just one more exciting example of meaningless white noise.

With all that said, it’s prudent to be cautious about going “all in” on this pullback in the market and to perhaps take some hard-earned partial profits on positions you’ve been holding. In our clients’ portfolios, we’ve upped our hedges and taken partial profits on short-term positions, but are still holding the majority of our equities and bonds.

With the action in the markets last week, we officially have the beginnings of a downtrend, but that can be very short-lived in this QE environment, so we remain on our toes. Be sure to consult with your advisor if you’re uncomfortable with your holdings or have trouble sleeping at night because of your positions. Nothing in this message should be construed as investment advice or suggestions to buy or sell any security.

If you have any questions or comments, please don’t hesitate to contact us or post them here. We are a fee-only fiduciary financial planning and investment advisory firm that always puts your interests first.

Have a great week!

Sam

Sam H. Fawaz CFP™, CPA
Registered Investment Adivsor Representative
NAPFA Registered Fee-only Advisor
Financial Planning Asssociation Member
(734) 447-5305
(615) 395-2010
http://www.ydfs.com

TheMoneyGeek thanks Bob Veres, publisher of Inside Information for his help with writing this guest post.

Investing by Population

The map you see below has been widely circulated among professional investors, and it tells an astonishing story.  The circle encloses less than an eighth of the world’s total land mass, but it includes more than half of the world’s population.  Within that circle are the world’s two most populous nations: China, with 1.35 billion people and India with 1.22 billion, plus countries that rank 4th in population (Indonesia, with 251 million), 8th (Bangladesh, with 164 million), 10th (Japan, with 127 million), 12th (Philippines, with 106 million), 13th (Vietnam, with 92 million), 20th (Thailand, with 67 million), 25th and 26th (Burma and South Korea, both with around 50 million).  Also in the circle: Nepal, Malaysia, North Korea, Taiwan, Sri Lanka, Cambodia, Laos, Mongolia and Bhutan.

Add them up and you have 3.64 billion total citizens, or roughly 51.4% of the world’s people.

CA - 2013-5-12 - World Map

So the immediate question is: why isn’t my investment portfolio 50% invested in this region of the world?  Why isn’t my portfolio weighted by population?

The answer is simple.  While this circle represents the world’s center of gravity as measured by people, it also surrounds some of the least efficient places to deploy your investment resources.  Take China, for example, where the same company’s shares trading on the Hong Kong stock exchange routinely cost two or three times more than shares trading in Shanghai, where Chinese residents buy and sell their stocks.  Both shares carry identical claims on assets and profits.

Why the difference?  Chinese residents invest through so-called A-shares, which most foreign buyers are forbidden to trade in.  The rest of us buy B shares trading in Shanghai or Shenzhen, or H shares traded in Hong Kong, or red chips if the companies are state-owned, or P chips if the Chinese company is incorporated outside of the mainland, or N shares for certain Chinese companies listed on the U.S. trading floors.  These other share classes share one thing in common: they trade at higher multiples than the relative bargains offered to Chinese citizens.  China has granted several foreign firms and investment groups permission to own limited amounts of A shares, but it’s not easy to know, from the outside, which firms have an inside track.

Another problem with investing in China is transparency–or, more precisely, the lack of it.  U.S.-based public companies are required to disclose their financials in great detail, and large accounting firms are required to audit and sign off on the accuracy of those statements.  In China, accounting standards run from lax to nonexistent, and the Chinese government can forbid foreign access to the books and records of any company on the theory that this might reveal “state secrets.”

Okay, so what about India?  Here again, the government forbids non-Indian investors to buy shares of publicly-traded companies. Only six of the 30 companies listed in the BSE SENSEX index–the Indian equivalent of the S&P 500–allow shares to trade on the U.S. exchanges.  A few Indian-focused exchange traded funds are allowed to buy shares.

Indonesia’s stock exchange, meanwhile, could be charitably described as “undeveloped.”  Currently, it facilitates trading in just 462 listed companies, which have a combined market value of $462.78 billion–almost exactly the current market capitalization of Apple Computer.  Trading activity on the Jakarta stock exchange makes up less than one tenth of one percent of the global investment flow.

Of course, the Japanese stock market is large and robust, but investors in Japanese stocks have been less-than-thrilled by their performance since 1991.  The Nikkei 225 Stock Market Index peaked at just under 40,000 22 years ago, and now is worth about 12,500.

There is no question that eventually the people living inside of this interesting circle will start punching their weight in the global economy and provide thriving investment opportunities that will conform to more stringent world standards.  For now, a prudent investor will avoid investing by population.  You should have some money in the emerging economies and watch closely the new developments in Japan, where the prime minister may be shaking the economy out of a decades-long slump.  There may come a time when it will be wise to put more than half of your investments into eastern Asia, but that time hasn’t quite arrived yet.

Sources:

http://www.washingtonpost.com/blogs/worldviews/wp/2013/05/07/map-more-than-half-of-humanity-lives-within-this-circle/

http://www.forecast-chart.com/historical-nikkei-225.html

http://www.indexuniverse.com/sections/white-papers/15113-the-complete-guide-to-chinese-share-classes.html?fullart=1&start=5

http://seekingalpha.com/article/829631-how-can-americans-invest-in-indian-stocks

http://en.wikipedia.org/wiki/Jakarta_Stock_Exchange

http://en.wikipedia.org/wiki/List_of_stock_exchanges

http://www.advfn.com/nyse/newyorkstockexchange.asp

http://en.wikipedia.org/wiki/Indonesia_Stock_Exchange

http://www.usnews.com/opinion/blogs/economic-intelligence/2013/01/11/the-us-must-challenge-chinas-accounting-standards

TheMoneyGeek thanks Bob Veres, publisher of Inside Information for this guest post.

Bond Market Outlook: Points to Ponder

During the past decade, many long-term fundamentals of investing have been turned upside down and one example is the performance of U.S. stocks compared with bonds. Over longer time periods, such as 20 or 30 years, stocks exhibited higher average annual returns along with greater volatility.Bonds, in contrast, presented lower long-term returns along with fewer ups and downs.

But the 10-year period ending December 31, 2011, has shown the opposite, with the average annual return of investment-grade bonds exceeding stocks by a margin of 5.8% compared with 2.9%.1 No one knows for sure whether the recent outperformance of bonds will continue, but events currently present in the U.S. economy are causing observers to question the outlook in the years ahead.

Interest Rates The Federal Reserve has maintained the federal funds rate between 0.0% and 0.25% with the goal of stimulating the economy. Given how low short-term interest rates are, it is likely that they will turn upward at some point, which would present challenges for bondholders. Historically, higher interest rates have caused the prices of existing bonds to fall as investors have pursued newly issued bonds paying higher rates. This scenario presents the potential for losses for existing bondholders.

Inflation During 2011, inflation averaged 3.2%, close to the historical average of 2.9%.But if inflation were to increase even higher, an investor would lose money on a bond with a yield lower than the rate of inflation. Some observers believe that if the U.S. economy begins generating stronger growth, inflation could once again spike upward.

Federal Spending Sizeable federal deficits are almost old news as the government looks for ways to stimulate the country’s economic engines. While economic growth is a laudable objective, outsized federal spending may impact the financial markets. If the federal government is forced to pay higher interest rates to entice investors to fund the debt, this action could lead to higher interest rates on other types of bonds as well in response to investor demand.

Bonds can help investors balance a portfolio weighted to stock funds or other assets. When making decisions about investments, it is important to weigh both the benefits and the risks associated with bonds and any other assets that you own.

Source/Disclaimer:

1Sources: Standard & Poor’s; Barclays Capital. Stocks are represented by the Standard & Poor’s 500 Index, bonds by the Barclays Aggregate Bond Index, volatility by standard deviation. Results are for the 30-year period ending December 31, 2011. You cannot invest directly in an index. Past performance does not guarantee future results. Investing in stocks involves risks, including loss of principal. Bonds are subject to market and interest rate risk if sold prior to maturity. Bond values will decline as interest rates rise and are subject to availability and change in price.

2Source: U.S. Bureau of Labor Statistics. Inflation is represented by the Consumer Price Index. Historical average is for the period between 1926 and 2011.

June 2012 — This column is provided through the Financial Planning Association, the membership organization for the financial planning community, and is brought to you by YDream Financial Services,a local member of FPA.

What’s Going on With The Markets? 3rd Quarter 2011

The headline on today’s Wall Street Journal says it all: “Stocks Log Worst Quarter Since ’09”, referring of course to the first quarter of 2009 before the start of the (current?) bull market run. Even quarter-end “window dressing”, where fund managers buy up the best performing stocks to make their holdings look good to shareholders and boost their chances of quarterly performance bonuses didn’t help at all. September 30th ended the day, week, month and quarter-end at an ominous level.
 
The shocks to the markets continue to come from the Eurozone debt crisis, worries of another recession starting, the Chinese economy slowing, and now, corporate earnings results for the third quarter coming in below estimates. Forward guidance, that is, how companies estimate their upcoming earnings, are expected to be pulled down a bit. With economic data continuing to soften or come in worse than expected, evidence is mounting that the economy continues to slow down, but not contract. Contraction for two straight quarters is the textbook definition of the start of a recession.
 
My most reliable source for forecasting a recession comes from the Economic Cycle Research Institute (ECRI). In the past, they have been spot on in identifying the conditions that precede the onset of a recession.  This week, although not confirming the start of a recession, the ECRI did confirm that evidence of a recession is spreading like wildfire and one would be almost impossible to avoid given current conditions.  Consumer confidence is at or near an all-time low due partly because of the whole debt ceiling debacle and political gridlock. Without confidence, and without jobs, people are not spending to help the recovery. Without spending, there’s no demand. Without demand, there’s no production and therefore no hiring. And you can complete that circle yourself.
 
As I’ve mentioned before, if we are headed for a recession, then stock prices will likely have to fall further before they are fairly priced. This is because earnings fall during a recession, and institutions only buy stocks when they’re fairly priced according to forward earnings. If we’re not headed for a recession, then stock prices are cheap and out to be bought hand over fist right here, right now. 
 
What we’ve witnessed in the stock markets over the past 8-9 weeks is extreme volatility brought on by the battle between those in the recession camp and those not in the recession camp (along with Eurozone worries).  Since the August 9th low in the markets, the S&P 500 has traded in a 100 point range and has basically gone nowhere.  This bouncing around will not continue forever (but can continue for months), and will give way to a big move up or down in the near future. The action during the past week tends to point to a downward move, but every downward move in this range looked like it was going to break down until buyers stepped in.
 
What I Believe and What We’re DoingAs evidence that points to a recession mounts, I’m becoming less convinced that we can avoid a recession in the next 3-6 months. This is a change from my previous stance of no impending recession in previous months. It’s become increasingly clear that the Federal Reserve is less able to influence what happens in the economy, and in my opinion, the less they do the better.
 
As the odds of a recession have been increasing, and world economies also slow, I have been slowly reducing client exposure to equities over the past couple of months. Our exposure to small cap stocks is now very small, and I began to reduce exposure to mid-cap stocks by up to 1/3 as of last week.
 
On Friday of this week, I increased our exposure to hedges via leveraged inverse exchange traded funds because I believe that we will test the August 9th low on the S&P 500 index of 1101 (current level of support) and may even break below it. I also believe that even if the market did decline by another 10% (should we break support) we still have a year-end rally in the cards.  Even if I’m wrong about reducing equity exposure and increasing our hedges, and the markets reverse and fly to the upside (not likely), prudent risk management based on the facts and circumstances warrant caution. It never hurts to reduce equity exposure when uncertainty and volatility rule the markets.
 
September 2011 was the 6th down month in a row in the stock markets, and bear markets typically last 6-18 months. If this is merely a correction and not a bear market, then 6 months is a good point in time to expect a bounce. My expectations, especially since this is the 3rd year of an election cycle, that somewhere along the lines of mid to late October, we begin to see the year-end bounce. 
 
As always, I offer my caveat: my crystal ball is in the shop and no one, including me, can forecast what the markets will do. I can only provide my best guess, and that’s what this is, a guess, based on all the information available to me and historical precedent, of what the markets may do. I could be totally wrong on both direction and timing, so no one should make any investment decisions based on my prognostications or forecast. Forewarned is forearmed.
 
I’m happy to answer any questions or comments you may have. If you already have a fee-only financial advisor (the only kind I recommend), then great. If you’re looking for an unbiased, fee-only financial advisor, don’t hesitate to contact us. Your first consultation is complimentary and comes with no pressure to act or sales tactics.  As fee-only fiduciary advisors, we act in your best interest and collect no commissions, trails or any hidden compensation.