Are Daughters a Better “Investment?”

As Father’s Day has now passed for this year, a new survey from the online account aggregation firm Yodlee.com and Harris Interactive tells us that the financial relationship between fathers (and parents) can be very different for their sons vs. their daughters.  The survey found that an astonishing 75% of young adult men (age 18-34) are receiving financial aid from their parents, compared with 59% for comparable age daughters.  The financial dependency extends deep into adulthood; among sons aged 35-44, fully 32% are still living at home, while only 9% of women in that age bracket sleep in their former bedroom.  Even those numbers understate the disparity, because more than a third of the women who are living with their parents are doing so to support them in old age, something that sons are, according to the report, far less likely to do.
 
Overall, daughters are 32% less likely to need their parents’ money, and twice as likely to move back home because they’re unemployed.  By age 45, the survey found, most of these stark differences in financial independence have faded; sons lag only a few percentage points behind daughters in these two areas.  But then a new discrepancy emerges.  The survey found that older sons are half as likely as daughters to support their parents in old age. 

If you have any questions about any financial planning or money management services, please don’t hesitate to contact us or visit our web site athttp://www.ydfs.com. As a fee-only fiduciary financial planning firm, we always put your interests first, and there’s never a charge for an initial consultation or any sales pitches.
 
Sources:  

http://www.businessinsider.com/daughters-require-less-financial-support-2014-6
 
http://time.com/money/2861530/daughter-better-investment-than-son/

Retirement Spending Revisited

How much are you going to spend in retirement?  What once seemed like a simple question has become incredibly complicated in recent years.
 
Why?  First of all, a diminishing number of people actually plan to leave work and embrace leisure on a full-time basis, and those who do, seem to be doing it later than people from earlier generations.  Of the oldest baby boomers, who are now age 68, only 52% are actually retired;  21% are still working full-time.   According to a Gallup survey, 37% of Americans say they plan to work full-time past the age of 65, but that may be underestimating the actual shift in preference.  A 2012 survey conducted by Transamerica found that just 19% of workers expect to retire full-time by age 65.
 
When people DO leave the workplace, it now appears that some of the assumptions about their spending habits will have to be revisited.  The default assumption for many retirement plans is that what you spend now for things like food, clothing etc. will remain pretty much the same the day after retirement as they were the day before.  Your home mortgage may or may not go away in retirement and the expenses related to commuting to and from work will diminish.  When you sort it all out, you end up with a baseline spending plan, which includes a new car every few years, dining out occasionally, making home improvements and other basic necessities.  These expenses have traditionally been assumed to increase each year roughly with the inflation rate.
 
On top of that, it was assumed that in the vigorous early years of retirement, people would spend more on travel and country club memberships than they did when they were working, so their overall expenses would go up the day after they retire and gradually diminish as they found it harder and harder to play 18 holes of golf every day.  At some point in the age curve, health expenses would start to rise.  The people who study retirement expenditures talked about a “smile” graph of expenses, where it cost more to live and play in the earlier and later years of retirement than in the middle years.
 
What’s wrong with that?  For one thing, when you look at the Bureau of Labor Statistics data on what people actually spend in their later years, it contradicts this comfortable smile pattern.  People between the ages of 65 and 74 tended, on average, to increase their annual spending levels between 1.11 percentage points and 1.78 percentage points more per year more than the inflation rate.  Over that decade of their lives, any assumption that used the inflation rate would undercount their aggregate spending by somewhere between 11% and 19%.  People age 75 and older accelerated their actual spending to (again over the course of the next decade) between 13% and 22% more than the inflation statistics would suggest.  After that, healthcare costs would start to dominate the spending pattern.
 
To make things more complicated, the statistics suggest that retirees tend to cut back on their spending whenever the investment markets go down.  In 2009, people age 75 and older, on average, spent less than they did the year before, and they actually spent less than that in 2010.  That same year, the average spending of people age 65-75 declined a remarkable 3.55%.  As your wealth goes down, so too does your spending.
 
How can we predict these things in advance?  We can’t.  And it’s important to remember that these broad statistics don’t apply to your individual circumstances; they just suggest things that most of us should watch out for.  The only clear conclusion of the research, thus far, is that we should probably make conservative assumptions about spending, and hope we’re pleasantly surprised as the years go on.

If you have any questions about retirement spending or planning or would like to discuss your personal circumstances, please don’t hesitate to contact us, or go tohttp://www.ydfs.com.  We are a fiduciary fee-only financial planning firm that always puts your interests first.
 
Sources:
 
Retirement:
http://capricorn.bc.edu/agingandwork/database/browse/facts/fact_record/5670/all
 
Spending:
http://www.marketwatch.com/story/hedonic-pleasure-index-going-beyond-the-cpi-2013-01-23
 
http://www.advisorperspectives.com/newsletters12/47-fallacies2.php

Bad Money Moves to Avoid

What are truly the very worst investments and financial products you can buy with your money? Those things that when all things are considered provide you the lowest chance for profit. 

According to the AARP, they include five primary types: alternative investments, time-shares, equity-indexed annuities, private and non-traded REITs, and oil drilling partnerships. You can read why each are to be avoided right here. To that list I would add most permanent (whole, universal, variable) life insurance policies, deferred annuities and non-publicly traded partnerships. 
 
In that same article, AARP also provided five clues to watch for to tell you when something isn’t right about an investment that is being sold to you. These are all good things to watch for:
 
1. An impossible promise: There’s no such thing as high returns with little or no risk. The best opportunities typically go to institutional investors: it’s much easier to raise money from a few big fish than to solicit thousands of small fry.
 
2. Complex terms: Perhaps the offer comes with hundreds of pages of technical and legal disclosure, and you’re required to sign a document saying you read and understood it all. Good investments are easy to grasp. My rule is never to buy anything I couldn’t explain to an 8-year-old. Ask yourself: would they write hundreds of (legal) pages to protect you or themselves?
 
3. A ticking clock: If you hear that this investment opportunity is available only for a short time, it’s the reddest of flags. The salesperson doesn’t want you to think it over or ask others for their opinion. Run, don’t walk away from these investments.
 
4. Fancy language: That would be words such as “structured,” “managed,” “deferred,” “derivative,” “collateralized” and even “guaranteed.” Of course, there is nothing wrong with an FDIC guarantee on your CD. But leaving cash at a bank or brokerage firm is a bad investment if you are earning 3 percent or less: you’re losing ground to inflation. A higher-paying CD is a better option if you’re not willing to take risk with your money.
 
5. A stranger calls: Be very careful of accepting a free-lunch “educational seminar.” I have yet to meet someone unknown to me who truly wanted to and could make me rich. Someone once said that you truly can’t afford “free”, and I have come to believe it.
 
Millions of investors fall prey to bad investments usually out of fear or ignorance. In addition, no matter how smart you may be or how much experience you have, studies also show that all of us can be very gullible and blinded by our greed.

Nevertheless, knowing what to avoid is an important part of being successful with investing and managing risk. Most of the time, anything sold to you by others as terrific alternatives to equities and fixed income, especially those with lots of hype, complexity and outrageous fees, must be avoided. Eliminating these bad investments from your consideration and portfolios is a must if you desire to give yourself the best chance for long-term investing and financial success.

If you have any questions about any investments or insurance products you might be considering, please don’t hesitate to contact us or visit our web site athttp://www.ydfs.com. As a fee-only fiduciary financial planning firm, we always put your interests first, and there’s never a charge for an initial consultation.

Sources:

AARP

The Kirk Report

What is Uncle Sam doing with your tax money?

Now that your tax money is in the hands of Uncle Sam, what will he do with it?  How will the government allocate your contribution to the overall budget?
 
Your Social Security payments are easy; they go to pay Social Security benefits to current retirees, and for now (the future is another matter), they fully fund that obligation. Some of that money also goes to cover a portion of Medicare’s expenses; the remainder is covered by general federal revenue.
 
Your income taxes are divided among several broad budgetary categories.  A surprisingly large chunk is spent on the military (27%) and military-related veteran’s benefits (5.1%).  Another 22.7% goes to various forms of healthcare for U.S. residents, including the rest of the Medicare bill plus Medicaid.  13.9% of your tax money goes to pay interest on Uncle Sam’s debt–paid out to Treasury bill and bond holders every six months.  Unemployment benefits take up another 9.8%.
 
In the “Everything Else” category on the government spending pie chart, a surprisingly low 4.5% is spent on running the government, including various agencies such as the FBI and immigration services.  A total of 4% goes to housing programs, community development and block grants, while education gets a 2% slice of the pie–for programs like Head Start, and also the Pell Grants for college students.  Less than 2% is spent on scientific research, international affairs, transportation and energy.
 
If you’d like to get a receipt from the government for your taxes paid, which itemizes how that money is spent, well, good luck petitioning the IRS.  But you can get a fairly accurate receipt from the National Priorities Project here: http://nationalpriorities.org/interactive-data/taxday/. Just type in this year’s tax payment from your 1040, find your state, click a button and you’ll see what you paid for in terms of government services, interest and overhead.  Depending on how you feel about our government spending priorities, it may make your tax experience more or less painful.

If you have any questions about how to plan to pay less in taxes through tax and financial planning, please don’t hesitate to contact or visit us at www.ydfs.com.
 
 
Sources:
 
http://money.cnn.com/2014/04/11/pf/taxes/how-federal-income-taxes-are-spent/index.html
 
http://nationalpriorities.org/interactive-data/taxday/

Employers Ramping Up Retirement Plan Features

Employers are enhancing their retirement plans and increasing access to professional investment advice in an attempt to bolster employee retirement readiness.

A new study by Aon Hewitt, which polled more than 400 plan sponsors serving 10 million plan participants, revealed a number of initiatives being taken to strengthen employee ability to achieve greater financial security in retirement. Key actions include the following:

  • Boosting employer matching funds: The percentage of employers offering dollar-for-dollar matches on the first 6% of employee contributions, has nearly doubled in the past two years, from 10% in 2011 to 19% today. And virtually all employers now offer some level of matching contributions.
  • Offering immediate eligibility: Three out of four employers now allow employees to begin participating in a workplace retirement plan as of their hire date — a dramatic increase over the 45% of employers that offered immediate plan eligibility in 2001. In addition, more than half of employers also offer “day one” access to employer matching contributions.
  • Providing access to Roth-style plans: Giving plan participants the option of choosing between a standard defined contribution plan and a Roth-style plan has become a priority for more employers in the past several years. Now 50% of employers allow Roth contributions (up 11% since 2008), and of those who offer the Roth option, 27% currently allow in-plan Roth conversions. Another 16% will offer this feature within the year.
  • Offering access to a range of advisory services: One of the fastest-growing benefit trends is the availability of various types of professional guidance, which is now offered by three out of four plan sponsors. One-on-one financial counseling tops the list (with 59% of plans offering), followed by online guidance (55% of plans), and managed accounts (52% — a significant jump from just two years ago when only 29% of plans offered this feature). Target-date funds — another form of investment guidance — are well into the acceptance curve, with 86% of plan sponsors offering them.

If you have any questions about your employer retirement/benefit plans or any other fee-only fiduciary financial planning matters, please don’t hesitate to contact us or visit http://www.ydfs.com.

Source:  Aon Hewitt news release, October 30, 2013.

Should You Consider a Health Savings Account?

As health care costs continue to rise, consumers must find ways to ensure that they have the funds to pay for medical expenses not covered through their insurance. One way to save specifically for health care costs is to fund a health savings account, or HSA.

HSAs are tax-advantaged savings accounts set up in conjunction with high-deductible health insurance policies. Enrollees or their employers make tax-free (pre-tax) contributions to an HSA and typically use the funds to pay for qualified medical care until they reach their policy’s deductible. The contribution made to the health savings plan is made in addition to your health insurance premium.

HSAs are not for everyone, and it is important to understand how they work before considering them to help fund health care costs.

Understanding HSAs

You are eligible for an HSA if you meet all four of the following qualifying criteria:

  1. You are enrolled in a qualified high-deductible health insurance plan (known as an “HDHP”).
  2. You are not covered by any additional health plan(s).
  3. You are not eligible for Medicare benefits.
  4. You are not a dependent of another person for tax purposes.

HSAs are generally available through insurance companies that offer HDHPs. Many employer-sponsored health care plans also offer HSA options. Although most major insurance companies and large employers now offer an HSA option under their health plan, it’s important to remember that most health insurance policies are not considered HSA-qualified HDHPs, so you should check with your insurance company or employer to see how an HSA plan might differ from your current plan.

There are maximum contribution limits that are adjusted annually. Contributions are made on a before-tax basis, meaning they reduce your taxable income. Note that unlike IRAs and certain other tax-deferred investment vehicles, no income limits apply to HSAs.

HSAs offer investment options that differ from plan to plan, depending upon the provider, and allow users to carry account balances over from year to year. Earnings on HSAs are not subject to income taxes.

Any medical, dental, or ordinary health care expense that would qualify as a tax-deductible item under IRS rules can be covered by an HSA. A doctor’s bill, dental procedure, and most prescriptions are examples of covered items. See IRS Publication 502 for a definitive guide of covered costs. If funds are withdrawn for any purposes other than qualifying health care expenses, you will be required to pay ordinary income taxes on amounts withdrawn plus a 10% additional federal tax.

Here are some pros and cons of this product.

Pros

  • HSAs offer a significant annual tax deduction, making them particularly appealing to individuals in higher tax brackets.
  • Withdrawals for qualifying health care costs (including long-term care insurance) are tax free.
  • Investment income in HSAs also accumulates tax free.

Cons

  • Since HSAs must be tied to HDHPs, their ultimate savings must be weighed against how such plans stack up against more traditional plans, which may offer significantly better coverage.
  • HSAs may not offer the flexibility and portability that today’s mobile American family requires, especially given that health plan offerings differ significantly from employer to employer, and many smaller institutions have yet to offer an HSA option.
  • For more information on HSAs, see the U.S. Treasury’s Health Savings Account resource page.

If you have any questions about Health Savings Accounts or any other financial planning matters, please don’t hesitate to contact us or visit http://www.ydfs.com

Taking Distributions from 529 College Savings Plans

Parents looking to take advantage of the many benefits of saving for college with a 529 plan will want to know the full details of which educational expenses qualify for tax-free distribution status — and which do not.1 In Publication 970, the IRS gives detailed guidance on qualified expenses. Here are a few important points:

What’s Covered

 Tuition and fees are covered in full.

  • Room and board, if the student is enrolled at least half time. But such expense must be not more than the greater of (1) the allowance for room and board, as determined by the school, that was included in the cost of attendance; or (2) the actual amount charged if the student is residing in housing owned or operated by the school.
  • Food. If you spend a certain amount for a meal plan, that entire amount can be deducted, even if used for coffee or ice cream and not a full meal. Weekend meals can also be included if the dining halls are not open.
  • Books and supplies. Any fees associated with purchasing school textbooks are considered qualified, as are required equipment or supplies such as notebooks and writing tools.
  • Computers/laptops, but only if required by the school. If required, Internet fees and PDAs or “smartphones” may also qualify. The Savings Enhancement for Education in College Act (H.R. 529) that is currently being considered by Congress would expand this definition to apply to all computer technology used by the student.
  • Special needs services required by special-needs students that are incurred in connection with enrollment or attendance at school.

 What’s Not Covered

 Student loans. Interest on or repayment of student loans is not considered a qualified expense by the IRS.

  • Insurance, sports or club activity fees, and many other types of fees that may be charged to students but are not required as a condition of enrollment.
  • Transportation to and from school.
  • Concert tickets or other entertainment costs, unless attendance is requisite to a course or curriculum.
  • Note that expenses must apply to a qualified college, university, or vocational school for post-secondary educational expenses. Also keep in mind that taxes and a possible 10% additional federal tax will apply to all distributions that are not considered qualified educational expenses by the IRS, so be sure to check first.

If you have any questions about saving and investing for college, please don’t hesitate to contact us or visit http://www.ydfs.com

1By investing in a 529 plan outside of the state in which you pay taxes, you may lose the tax benefits offered by that state’s plan. Withdrawals used for qualified expenses are federally tax free. Tax treatment at the state level may vary.

Would You Pay Less Taxes in Another Country?

Tax day has passed in the U.S., along with the usual complaints about the complexity and financial burden that federal and state taxes (and FICA) impose on our lives. But have you ever wondered how U.S. taxes compare with what citizens in other countries have to pay?

Recently, the accounting firm PricewaterhouseCoopers calculated the tax burden, for tax year 2013, for people living in 19 of the G20 nations (the 20th member is the European Union, which has a variety of tax regimes). The report looked first at people who are in the upper-income levels–a person with a salary equivalent of $400,000, with a home mortgage of $1.2 million. After all income tax rates and Social Security (or equivalent) contributions have been taken out, what percentage of his/her income would this person have left over?

The people we should have the most sympathy for on our annual tax day live in Italy, where this person would get to keep $202,360 of that $400,000 income–or 50.59%. A comparable person living in India would keep 54.9%, while someone living in the United Kingdom would keep 57.28%.

Here’s the full list. Notice that the U.S. is about in the middle of the pack:

19. Italy – 50.59%
18. India – 54.90%
17. United Kingdom – 57.28%
16. France – 58.10%
15. Canada – 58.13%
14. Japan – 58.68%
13. Australia – 59.30%
12. United States – 60.45%
11. Germany – 60.61%
10. South Africa – 61.78%
9. China – 62.05%
8. Argentina – 64.02%
7. Turkey – 64.64%
6. South Korea – 65.75%
5. Indonesia – 69.78%
4. Mexico – 70.60%
3. Brazil – 73.32%
2. Russia – 87%
1. Saudi Arabia – 96.86%

Before you conclude that the U.S. is below average on this list, you should know that PricewaterhouseCoopers applied New York state (13.3%) and New York city (maximum 3.9%) taxes on the American calculation. If it had used Texas or Florida state tax rates instead, the U.S. would easily have ranked somewhere in the top ten.

And this list is somewhat skewed because so many European countries are left off, because they are lumped into the EU. It also doesn’t include Canada, which imposes a 29% top federal tax rate on its citizens, and then tacks on a maximum 25.75% rate at the province level.

PricewaterhouseCoopers did include many of the EU countries when it calculated the tax burdens on people with average incomes, and here the list looks somewhat different. The accounting firm assumed that a hypothetical married couple, with two children, earned the average income in each nation, and then calculated the overall tax rate the family would have to pay.

Denmark – 34.8%
Austria – 31.9%
Belgium – 31.8%
Finland – 29.4%
Netherlands – 28.7%
Greece – 26.7%
United Kingdom – 24.9%
Germany – 21.3%
United States – 10.4%
South Korea – 10.2%
Slovak Republic – 10%
Mexico – 9.5%
Chile – 7%
Czech Republic – 5.6%
(China, Russia, South Korea, Indonesia and Brazil would assess 0% taxes on this hypothetical family)

Does this mean that the U.S. tax system is fair? Or equitable? It depends on your perspective. Tax rates in the U.S. have been as high as 94% on all income over $200,000 (1944-45), and as low as 28% (1988-1990), with the bulk of years coming in between 40% and 70%. Meanwhile, some countries assess more taxes from corporations than from their citizens, while some have it the other way around. And some nations are evolving. At the beginning of World War II, individuals and families paid 38% of the total federal tax burden, and corporations picked up the other 62%. Today, thanks to aggressive lobbying, corporations have turned that around and then some. Individuals and families pay 82% of today’s total federal income tax haul, and corporations pay 18%.

We should also remember that high taxes don’t necessarily correlate with economic misery or poverty. Consistently, Belgium, which had the highest tax burden on average wage-earners (and imposes a top 50% rate on upper-income citizens) also consistently scores as one of the happiest countries in the world.

Sources:

http://www.bbc.com/news/magazine-26327114

http://billmoyers.com/2013/10/03/the-us-has-low-taxes-so-why-do-people-feel-ripped-off/

Click to access nyc_tax_rate_schedule.pdf

http://www.ntu.org/tax-basics/history-of-federal-individual-1.html


20 Things to Know about the Russian Incursion into Ukraine

Image

Our hearts and prayers go out to the people of Ukraine, as they undergo both an internal political crisis and what appears to be military intervention from Russia.  For people of a certain age, the current events, with tanks rolling across the Russian border into a neighboring nation that wants to exercise its freedom, it feels a bit like the Cold War days all over again.

Whenever we see troop movements and fires raging in the streets of a capitol city the size of Chicago, our instinct is to assume the worst and move our money to the sidelines.  But is this really the best strategy?  Some commentators see any market downturn as a buying opportunity, since stocks are going on sale simply because of unfounded fear of economic aftershocks.

Here are some facts that you might not know about what has, hitherto, been a relatively quiet new member of the world economic community.

1) The word “Ukraine” means “borderland” in proto-Slavic.  It appears to have acquired this name simultaneously from Poland, Austria and Russia, referring to the territory that sits across the border of so many European nations and Russia.  In fact, the Polish referred to their troops stationed in this area as Ukranians–that is, borderlanders.  Since the country became independent from the Soviet Union, it is no longer referred to internationally as “The Ukraine.”

2) Ukraine’s currency is the hryvnia, adopted in 1996 after the country suffered the greatest one-year bout of hyperinflation in global economic history.  (Zimbabwe has since broken the record.)  Today, one dollar will buy 9.6 hryvnias.  A euro will buy 13.3 of them.

3) After Russia, Ukraine has the largest military presence in Europe.  Ukrainian troops have been deployed as part of international peacekeeping missions in Somalia, Kosovo, Lebanon and Sierra Leone, and has engaged in multinational military exercises with U.S. military forces.  NATO has accepted Ukraine as a member pending a national referendum on the matter–which will obviously be delayed until the conflict with Russia has played itself out.

4) Ukraine has one of the world’s most active space programs.  The National Space Agency of Ukraine has launched six self-made satellites and a total of 101 launch vehicles.  The country also manufactures the An-225 aircraft, the largest aircraft ever built.

5) Due to low birth rates, Ukraine’s population is declining at the sixth fastest rate in the world, behind the Cook Islands, the Federated States of Micronesia, the Northern Mariana Islands, Niue (an island nation in the South Pacific) and the Eastern European nation of Moldavia, which borders Ukraine.

6) Nevertheless, Ukraine’s largest city, Kiev, has a higher population (2.8 million) than Chicago, America’s third-largest city.  The population of Kharkiv, Ukraine’s second-largest city (1.4 million), is greater than San Antonio, San Diego and Dallas, America’s seventh, eighth and ninth most populous cities.

7) According to the World Bank, Ukraine’s economy is the 51st largest in the world, ranking just behind Peru and the Czech Republic,a nd just ahead of Romania and New Zealand.  But its $7,295 (US) per-capita income (a rough measure of a nation’s wealth) ranks 106th in the world, behind Namibia and El Salvador and ahead of Algeria, Micronesia and Iraq.

8) Ukraine co-hosted the Euro 2012 football (soccer) tournament (with Poland), which is one of the major sporting events in Europe.

9) Even though the Chernobyl nuclear disaster occurred in Kiev, Ukraine operates the largest nuclear power plant in Europe.

10) Despite comments that Ukraine is divided between ethnic Ukrainians and Russia, 77.8% of the population is ethnic Ukraine, and only 17.3% is Russian.

11) Ukraine is known as the “breadbasket of Europe” for good reason.  The country is the world’s fourth largest producer of barley, 5th largest producer of rye, 11th largest producer of wheat, the 6th largest producer of oats and the 9th largest producer of soybeans.

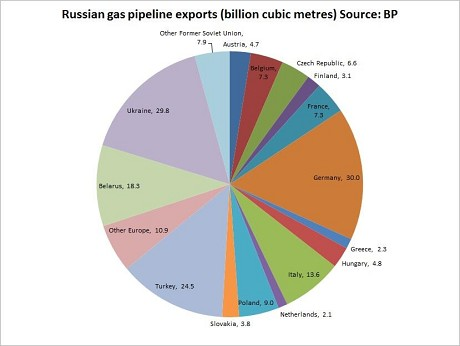
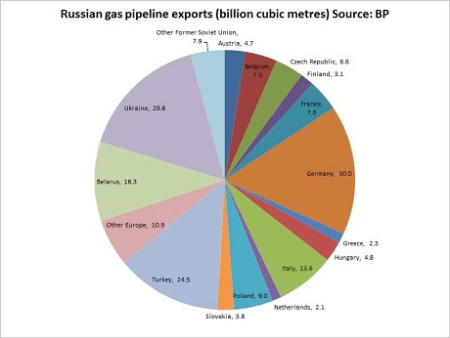
12) Russia sells approximately 80% of its oil and gas exports to the European Union through pipelines that pass directly through Ukraine.  The European Union receives 25% of its oil and gas from Russian sources through these conduits.
Image
13) Ukraine also happens to be Russia’s second-largest customer of petro-fuels.

14) Russia is drilling for oil in the shallow waters of the Black Sea near the Crimean Peninsula, which shows promise of having significant reserves.

15) Among others drilling in the same area: Chevron and Shell Oil.  If they begin production under the Ukrainian flag, it would significantly undercut Russia’s oil and gas market share and prices, simultaneously boosting Ukraine’s economy.

16)  When the Russians (as the Soviet Union) invaded Afghanistan in 1979, the U.S. and many Western nations boycotted the 1980 Olympic games, which were hosted in Russia.  Is it interesting that Russia decided to move forces into Ukraine immediately AFTER the Sochi Olympics were finished?

17) Among the most likely responses to the Russian/Ukrainian crisis is the cancellation of the upcoming G8 summit in Sochi.  Another possible response might remove Russia from the G8 club.  This would embarrass Russian strongman Vladimir Putin at home and isolate him (and Russia’s economy) abroad.

19)  Russia’s economy could be the big loser in the aftermath of the Ukrainian crisis.  Share prices for companies based in Russia declined by 10 percent the day after mysterious soldiers took over the Crimean peninsula, also triggering an outflow of domestic currency that Russia desperately needs to invest in modernizing an economy largely (today) based on selling abroad what is pumped or mined out of the ground.

20) The threat of disruption of trade between Western nations and Russia (either due to sanctions or reluctance to deal with a country that doesn’t seem to be focused on following international law) cost the Russian economy $60 billion in a matter of days–more than the total cost to stage the Sochi Olympics.

21) (bonus) Let’s assume that we are not headed toward a world war.  Several commentators have unhelpfully pointed out that the Crimea became the flashpoint for World War I, but the world is somewhat different today.  There could be some impact from higher energy prices in Europe if the Ukraine pipelines are disrupted temporarily, but Russia needs to sell its oil and gas as much as Europe needs to buy it.  Unless someone is heavily invested in Russian stocks, the crisis will likely be seen as a portfolio non-event.

Image

Sources:

http://www.cnbc.com/id/101458530

http://redmoneyupdate.com/tag/ukranian-crisis-and-how-it-may-impact-investments/

http://www.fool.com/investing/general/2013/12/10/growing-uncertaintly-in-the-ukraine-could-impact-l.aspx

http://en.wikipedia.org/wiki/List_of_largest_producing_countries_of_agricultural_commodities

http://en.wikipedia.org/wiki/Ukraine

http://www.reuters.com/article/2014/03/03/us-urkaine-crisis-russia-economy-analysi-idUSBREA221D020140303

Is myRA Your Next Retirement Plan?

Chances are, you’ve heard about the new myRA retirement savings program that was proposed by President Obama during his State of the Union speech.  But what is it, and how does it relate to the array of other retirement savings options you already have–including, of course, traditional and Roth IRAs, 401(k) or 403(b) plans?  Is this something you need to be looking at in addition to, or instead of one of these other options?
 
The new account, which is scheduled to be introduced later this year, will be offered to workers who currently don’t have access to any kind of retirement program through their employers.  Remarkably, this underserved population is actually about half of all workers, mostly those who work for small companies which have trouble affording the cost of creating and administering a 401(k) plan.  The idea is that a myRA would be so easy to install and implement (employers don’t have to administer the invested assets), and cost so little (virtually nothing), that all of these smaller companies would immediately give their employees this savings option.
 
Only some of the employees would be eligible, however.  Married couples earning more than $191,000, or singles earning more than $129,000, would be excluded from making myRA contributions.  And there is currently no law which says that employers would be required to offer these plans.
 
So the first thing to understand is that people who already have a retirement plan at work, or who earn more than the thresholds, shouldn’t give the myRA option a second thought.
 
Nor, frankly, would those people want to shift over to this option.  Why?  myRA functions much like a Roth IRA, which means that contributions are taxed before they go into the account just like the rest of a person’s salary, but the money will come out tax-free.
 
Anybody can make annual contributions to a Roth IRA; the 2014 maximum is $5,500 for persons under age 50; $6,500 if you’re 50 or older–and these are the same limits that will be imposed on the myRA.  BUT–and this is a big issue–the myRA is not really an investment account.  Any funds that are contributed to a myRA account earns interest from the federal government at the same rate that federal employees earn through the Thrift Savings Plan Government Securities Investment Fund–which is another way of saying that the money will be invested in government bonds.
 
Why does that matter?  Retirement accounts that invested solely in the stock market earned close to 30% from their stock investments last year.  The government bond investments that would have gone into a myRA earned 1.89% last year–which is below the inflation rate.  In real dollars, that was a losing investment.
 
Another big issue is the employer match.  Many workers who have a traditional 401(k) account get some of their contributions matched by their company, which effectively boosts their earnings.  myRA accounts will get no such match.
 
The Obama Administration clearly understands the difference between saving in a government bond account and actual investing.  Accordingly, there is a provision that whenever a myRA account reaches $15,000, it has to be rolled into a Roth IRA, where the money can be deployed in stocks, bonds or anywhere else the account holder chooses.  The program seems to be designed to encourage younger workers to start saving much earlier than they currently do.  Statistics show that the median retirement account for American workers age 25-32 is just $12,000, and 37% have less than $5,000. 
 
Will they be motivated to save when myRAs roll out at the end of the year?  Some commentators have noted that the money can be taken out of the account, for any reason, at any time, with no tax consequences.  That’s not a great formula for long-term savings.  But it does make the myRA account a convenient way for a worker just starting out to build up a cash reserve which could serve as a cushion against job loss or unexpected expenses like car repairs.  If it is not needed, the account could eventually grow into a retirement nest egg.
 
If you have any questions about the myRA or any other investment, retirement or financial planning matter, please don’t hesitate to ask.  We are a fee-only financial planning firm that always puts your interests first.