Medicare Cost Increases

At the same time it was announcing that Social Security recipients wouldn’t receive any increases in their benefits, the government was announcing that certain Medicare participants would be paying dramatically higher premiums for Medicare Part B, the highest price jump in the program’s history. In general, the higher premiums will affect new enrollees in 2016, enrollees who don’t yet collect Social Security checks, enrollees with incomes above $85,000 (single) or $170,000 (married), and dual Medicare-Medicaid beneficiaries. In all, that represents 30% of 2016 Medicare beneficiaries—roughly 7 million Americans.

This jump in some recipients’ costs is, ironically, tied to a relative bargain for others. Under something called the “hold harmless” clause in Social Security, in years when there is no cost of living increase in Social Security payments, the government also has to keep Medicare Plan B the same for those receiving Social Security payments. Under current law, the government has to collect 25% of all expected Part B costs from recipients each year. As a result, this relative bargain for many retirees had to be paid for by others—meaning: those NOT receiving Social Security checks.

Medicare recipients who are not taking Social Security checks, who fall below the income thresholds, will see their monthly premiums go up from $104.90 to $123. Those whose income is above the threshold could see increases of $223 a month up to $509.80 a month for individuals whose family income exceeds $428,000 a year.

So next year will see some retirees make out better than expected on their Medicare costs, while others will lose big. There are proposals in Congress to fix this situation, but you shouldn’t expect any big reform in an election year. Should you take matters into your own hands and start collecting Social Security benefits—putting you in the protected class of Medicare recipients? Probably not. First, for those under age 70, it means locking in lower Social Security benefits. And second, if your income is above the $85,000 (single)/$170,000 (joint) thresholds, you will pay higher premiums anyway.

If you would like to review your current investment portfolio or discuss any other financial planning matters, please don’t hesitate to contact us or visit our website at http://www.ydfs.com. We are a fee-only fiduciary financial planning firm that always puts your interests first.  If you are not a client yet, an initial consultation is complimentary and there is never any pressure or hidden sales pitch.

Sources:

http://www.aarp.org/health/medicare-insurance/info-2015/medicare-part-b-premiums-could-spike.html?intcmp=HP-FLXSLDR-SLIDE1-MAIN

https://www.medicare.gov/your-medicare-costs/part-b-costs/part-b-costs.html

The MoneyGeek thanks guest writer Bob Veres for his contribution to this post

No Social Security Benefit Increase This Year

You’ve probably heard by now that the 2016 cost of living (COLA) adjustment for Social Security benefits is zero—the third time this has happened in the last seven years. (2010 and 2011 were the other recent years.) In fact, Social Security benefit increases have stalled since the Great Recession; only once since 2008 have they risen by more than 2%.

For many retirees, this was surprising news. Anybody who has visited the grocery store lately knows that the price of food is rising. Every day, the papers tell us that housing costs are increasing and medical care costs are also rising.

You will undoubtedly see websites which blame the Obama Administration or Democrats generally for trying to balance the federal budget on the backs of people who have paid into the Social Security system, but in fact the annual COLA calculation is automatic and set by formula.

The formula is something called the Consumer Price Index for All Urban Wage Earners and Clerical Workers, known to economists as CPI-W, calculated by the government’s Bureau of Labor Statistics in an effort to make the purchasing power of Social Security as close as possible to the same each year. The CPI-W was attached to Social Security payments in 1972 and has never been replaced. There are many components, and indeed most of them rose in 2015. Food was calculated to be 1.6% more expensive than it was last year; shelter costs rose 3.2% and medical costs were up 2.4%. Ironically, the falling price of gasoline was the factor which drove the CPI-W back to zero; the index tells us that energy prices declined 18.4% this year.

Is this a fair way to calculate actual costs of living? Many believe it is not, for several reasons. First, the CPI-W is a weighted formula, based on the costs of urban workers, not retirees. Therefore, it presupposes, in the weightings, a very different lifestyle than most Social Security recipients are living. The price of gasoline, for example, is assumed to represent 20.1% of a retiree’s total expenditures, which may be true for somebody who commutes to work every day in one of America’s major cities, but doesn’t reflect the normal lifestyle of a retiree. Medical care is assumed to be 5.1% of a retiree’s annual expenditures. For a young office worker, that may be a slight overstatement. For a retiree over age 70, it is almost certainly a gross understatement.

Recreation is assumed to be 5.4% of expenditures, which again sounds about right for the office worker who brings home work on the weekends. But a retiree almost certainly spends more on travel and greens fees. (Amusingly, college tuition is assumed to be 1% of the average CPI-W person’s expenditures.)

Is there a way to fix the formula so it more accurately reflects the actual costs of living in retirement? The Bureau of Labor Statistics actually calculates, each year, something called the Consumer Price Index for the Elderly. In that index, transportation costs are assumed to make up a more realistic 14% of yearly expenditures, and medical care counts double the CPI-W figure: 10.9% of assumed expenditures. Curiously, the index assumes that retirees spend less money on recreation (4.4%) and food away from home (4.6%, compared with 6.4% for that urban worker). The Social Security Administration has calculated that if it had been using the CPI-E COLA each year, rather than the CPI-W, the result would have been significantly higher Social Security benefits, more than 15% higher than today’s payments.

So is it time to push for a switch? Alas, the proposals currently in Congress have nothing to do with the CPI-E. Our elected representatives want to switch the index tied to Social Security benefits to something called the “chain-weighted CPI,” which annually comes up with lower COLA figures—and would, indeed, help balance the budget on the backs of seniors. Instead of complaining, should we celebrate the fact that the cost of living calculation wasn’t negative for next year?

With the federal reserve holding interest rates at zero percent, and now no COLA increase for social security recipients, our senior citizens continue to see an erosion of their buying power and no return on their low-risk savings which they worked a lifetime to accumulate. It certainly doesn’t seem very fair, and makes the case for careful financial planning very clear.

If you would like to exchange thoughts about your social security benefits or discuss any other financial planning matters, please don’t hesitate to contact us or visit our website at http://www.ydfs.com. We are a fee-only fiduciary financial planning firm that always puts your interests first.  If you are not a client yet, an initial consultation is complimentary and there is never any pressure or hidden sales pitch.

Sources:

http://www.usatoday.com/story/money/personalfinance/2015/10/16/tips-social-security-recipients-worried-no-cola-2016/73993428/

http://www.nbcnews.com/business/retirement/social-security-benefits-remain-unchanged-next-year-n445066

http://www.socialsecurity.gov/policy/docs/ssb/v67n3/v67n3p73.html

The MoneyGeek thanks guest writer Bob Veres for his contribution to this post

Searching for Yield in Today’s Market

Income-oriented investors have had a tough go of it for the past several years. Persistently low interest rates have curtailed traditional sources of yield. Yet, by broadening their search criteria, investors may uncover new ways to diversify their income portfolios with potentially more attractive options.

Consider Total Return

When evaluating income-generating opportunities investors need to consider total return — income plus price appreciation, while maintaining a consistent focus on risk reduction. When you think in these terms, certain asset classes can emerge as relatively more attractive. Given these parameters, here are a few equity and fixed-income investments to consider.

Equity real estate investment trusts (REITs) — Equity REITs are investments consisting of diversified portfolios of commercial real estate that are publicly traded on major exchanges.1 Because their focus tends to be on owning U.S.-based properties, equity REITs stand to benefit from improving economic conditions, such as the boost in U.S. job growth, which, in turn, could increase demand for commercial real estate. From a yield perspective, REITs are required to distribute 90% of their annual income to shareholders in the form of dividend payments.

When this income-generating capability is coupled with real estate’s potential to appreciate in value, equity REITs may be considered an attractive investment from a total return perspective. To manage risk, it is wise to maintain a portfolio that is broadly diversified by property type, location, and geographic area. In addition, even though equity REITs are considered equity investments, they historically have had a low correlation with stocks, which allows investors to benefit from the potential for enhanced returns while lowering their equity portfolio’s overall risk profile.

Global bonds — One of the key arguments for considering an allocation to global bonds is to add currency exposure to a portfolio.2 Although currency adds another level of volatility to a portfolio’s fixed-income allocation, it also provides investors with a natural hedge against the devaluation of the dollar, which traditional domestic fixed-income asset classes cannot offer. Another reason to consider adding global bonds is the prospect for higher economic growth rates outside the United States (see table below).2 As world economies grow more quickly, investors with an exposure to global bonds stand to benefit from this growth.

World Economic Growth Rates

2014 2015 — Projected
United States 2.4% 3.1%
Developed World (incl the USA) 1.8% 2.4%
Emerging/Developing Markets 4.6% 4.3%

Source: International Monetary Fund, World Economic Growth, April 2015.

When researching global bonds from an income perspective, it may be important to consider that many foreign countries typically run on different business/interest rate cycles than the United States. Therefore, when interest rates are higher abroad, global bond investors potentially may be able to take advantage of these varying cycles to earn higher yields.

Keep in mind that unlike international bond funds, which typically are bound by their investment policies to adhere to a non-U.S.-allocation mandate, managers of global bond funds have the flexibility to shift allocations out of foreign markets back into domestic securities (and vice versa) as conditions warrant. In this way, U.S. investors in global bonds may potentially gain protection on the downside while retaining the ability to participate on the upside.

Leveraged loans — When considering high yield, few investors tend to think of leveraged loans.3 Briefly, leveraged loans are floating rate loans that banks make to below-investment-grade companies, hence their high-yield status. Since they are adjustable rate instruments, tied to short-term interest rates, they can provide investors a hedge against interest rate risk — if interest rates rise, the coupon on the loan resets accordingly. This feature can potentially result in better performance relative to longer-term fixed income in a rising rate environment, as traditional fixed-income asset prices tend to move inversely with changes in interest rates.

One unique feature of leveraged loans that makes them potentially less risky than traditional high-yield bonds is their senior-secured status, meaning in case of a potential default, investors in leveraged loans may be more likely to get their money back.

If you would like to review your current investment portfolio or discuss any other financial planning matters, please don’t hesitate to contact us or visit our website at http://www.ydfs.com. We are a fee-only fiduciary financial planning firm that always puts your interests first.  If you are not a client yet, an initial consultation is complimentary and there is never any pressure or hidden sales pitch.

Source/Disclaimer:

1The stock prices of companies in the real estate industry are typically sensitive to changes in real estate values; property taxes; interest rates; cash flow of underlying real estate assets; occupancy rates; government regulations affecting zoning, land use and rents; and the management skill and creditworthiness of the issuer. Companies in the real estate industry may also be subject to liabilities under environmental and hazardous waste laws which could negatively affect their value.

2Foreign bond investments involve greater risks than U.S. bond investments, including political and economic risks, the risk of currency fluctuations, as well as liquidity risks and may not be suitable for all investors.

3Lower-quality debt securities involve greater risk of default or price changes due to changes in the credit quality of the issuer. They may not be suitable for all investors.

2015 Third Quarter Review

Many investors will be glad to finally see the end of the third quarter of 2015, and most of them will feel like their portfolios are worse off than they actually are. That whooshing sound you hear is not just air being let out of the markets; it’s also an end to that optimistic feeling that many people had been cautiously building during the long 6-year bull market that followed the Great Recession.

The past three months turned yearly gains into yearly losses almost completely across the board of the investment opportunity set. The Wilshire 5000–the broadest measure of U.S. stocks—fell 6.91% in the third quarter of 2015, posting a total return of -5.79% in the first half of the year. The comparable Russell 3000 index is down 5.45% so far this year.

The Wilshire U.S. Large Cap index dropped 6.44% of its value for the quarter, and is now down 5.15% for 2015. The Russell 1000 large-cap index is down 5.24% so far this year, while the widely-quoted S&P 500 index of large company stocks posted a loss of 6.94% in the third quarter, and is now down 6.75% for the year.

The Wilshire U.S. Mid-Cap index lost 8.96% for the quarter, and is now off 4.86% as we head into the fourth quarter. The Russell Midcap Index has lost 8.58% so far this year.

Small company stocks, as measured by the Wilshire U.S. Small-Cap index, gave investors a 10.88% loss during the latest three months, which takes the index down 7.29% so far in 2015. The comparable Russell 2000 Small-Cap Index is down 7.73% in the first three-quarters of the year, while the technology-heavy Nasdaq Composite Index lost 7.35% for the quarter, and stands at a 2.45% loss for the first three quarters of the year.

Meanwhile, in the global markets, the broad-based EAFE index of companies in developed foreign economies lost 10.75% in dollar terms in the third quarter of the year, for a negative 7.35% return so far this year. In aggregate, European stocks lost 9.07%, and are down 7.33% for the year. Emerging markets stocks of less developed countries, as represented by the EAFE EM index, were down a whopping 18.53% for the quarter, and are down 17.18% for the year.

Looking over the other investment categories, real estate investments, as measured by the Wilshire U.S. REIT index, gained 2.88% for the third quarter, but is still standing at a 3.01% loss for the year. Commodities, as measured by the S&P GSCI index, lost 19.3% in the third quarter, largely due to a fall in oil prices that may be nearing its end. They are down 19.46% this year.

There were many contributors to the loss of confidence in the stock market, and they appear to have been mainly psychological. Analysts blame the Federal Reserve Board for not having raised rates as the so-called “smart money” seems to have expected in September. Why are low rates a bad thing? Because Fed economists seem to believe that the economy has not recovered sufficiently to warrant stopping the central bank’s long-running stimulus program. Who are we investors to argue with the Fed economists?

Except… The explanation for not raising rates had little to do with actual economic activity, which is finally moving ahead, as of the second quarter, at an annualized 3.9% growth rate for U.S. GDP. This is higher than the 3.7% estimate from the Bureau of Economic Analysis, and much higher than the 2% rate that the U.S. economy has experienced since 2009. At the same time, consumer income, wages and salaries, and spending are all increasing modestly, existing home sales are growing at a 6.2% rate over last year, and the unemployment rate, once higher than 10%, has finally dropped down to the 5% range.

The Fed explained that it was delaying its rate rise because the core inflation rate—currently 1.83%, is below the 2% target rate the Fed set back in June 2012. Some people believe low inflation is a GOOD thing, and speculate that’s the real reason.

And another reason why many investors are nervous about the markets—could be the slower growth of the Chinese economy, coupled with the recent unnerving drop in its stock market. Unfortunately, the Chinese government controls the economic statistics that come out of the world’s second largest economy, which makes it hard to know exactly how fast China is or isn’t growing. But it’s worth noting that Chinese stock prices, even after the drop, are still up 31.6% from where they were a year ago.

For the time being, investors will have to continue to accept interest rates at historically low levels. The Bloomberg U.S. Corporate Bond Index now has an effective yield of 3.42%. 30-year Treasuries are yielding 2.87%, down from 3.13% a quarter ago, and 10-year Treasuries currently yield 2.06%, down from 2.36% in June.

At the low end, the yield on 3-month U.S. T-bills remains at 0.01%. 6-month bills are only slightly more generous, at 0.08%. Long-term (30-year) municipal bonds are yielding 3.16%, more than comparable Treasuries, and you get the federal tax-exemption thrown in for good measure.

When you look at the decline year-to-date, you see relatively small losses. But many investors are remembering that they were 10-15% wealthier just a couple of months ago, measuring their pain from the high point of the various indices. It’s tough to watch your portfolio go down, but it’s also worth remembering that people have been predicting a significant downturn—erroneously—for the better part of six years. Now that the downturn has finally arrived, it hasn’t been terribly painful, mostly giving back gains that were posted in the first two quarters.

The third quarter could be a temporary drawdown that sets the market up for a push back into positive territory by the end of the year, which would give us a record seven years of positive market performance. Or we could see the year end in negative territory, perhaps even giving us the first true bear market (defined as a drop of 20% from the peak) since the Great Recession. We don’t know how the psychology of millions of investors will turn in the next few months, and neither do the smart money analysts who thought that interest rates would be nudged upward by our central bank last month.

We do, however, have confidence that the next bear market will be followed by yet another bullish period that will eventually take us back into record territory, and we’re pretty sure that the markets will punish anyone who tries to outguess their unpredictable behavior in the short term. If you know what the next quarter will bring, please tell us now. Meanwhile, perhaps we should celebrate the fact that we can buy many kinds of investments at cheaper prices than we could just three short months ago. It’s not much, but it’s something to feel good about.

In our client portfolios, our returns this quarter were buffered by a larger than normal cash position, investments in inverse funds, a focus on defensive sectors, and by selling call options against some of our positions. If the market chooses to launch a 4th quarter rally, we’ll be ready for it. It may even have already started. But if the market instead chooses to go the bear route, we’ll increase our defensiveness further.

If you would like to review your current investment portfolio or discuss any other financial planning matters, please don’t hesitate to contact us or visit our website at http://www.ydfs.com. We are a fee-only fiduciary financial planning firm that always puts your interests first.  If you are not a client yet, an initial consultation is complimentary and there is never any pressure or hidden sales pitch.

Sources:

Wilshire index data: http://www.wilshire.com/Indexes/calculator/

Russell index data: http://www.russell.com/indexes/data/daily_total_returns_us.asp

S&P index data: http://www.standardandpoors.com/indices/sp-500/en/us/?indexId=spusa-500-usduf–p-us-l–

http://www.tradingeconomics.com/united-states/unemployment-rate

Nasdaq index data: http://quicktake.morningstar.com/Index/IndexCharts.aspx?Symbol=COMP

International indices: http://www.mscibarra.com/products/indices/international_equity_indices/performance.html

Commodities index data: http://us.spindices.com/index-family/commodities/sp-gsci

Treasury market rates: http://www.bloomberg.com/markets/rates-bonds/government-bonds/us/

Aggregate corporate bond rates: https://indices.barcap.com/show?url=Benchmark_Indices/Aggregate/Bond_Indices

Aggregate corporate bond rates: http://www.bloomberg.com/markets/rates-bonds/corporate-bonds/

Muni rates: https://indices.barcap.com/show?url=Benchmark_Indices/Aggregate/Bond_Indices

http://www.bloomberg.com/news/articles/2015-07-01/global-equity-axis-tilts-east-even-as-china-takes-gloss-off-gain

http://money.cnn.com/2015/06/29/investing/china-stocks-bear-market/index.html

http://www.reuters.com/article/2015/10/01/us-usa-economy-idUSKCN0RV4I120151001

http://www.theguardian.com/business/2015/sep/28/us-stock-markets-fall-concerns-china-economy

http://www.usnews.com/news/business/articles/2015/10/01/asia-stocks-higher-china-manufacturing-index-ticks-higher

http://www.usnews.com/news/articles/2015/09/29/will-russias-move-ruin-erdogans-plan-for-syria?int=af8409

http://www.usnews.com/news/articles/2015/10/01/federal-reserve-stands-pat-on-interest-rates-as-an-anxious-world-waits?int=a6f909

The MoneyGeek thanks guest writer Bob Veres for his contribution to this post.

Should You “Fix” Variable Rate Debt?

While investors are keeping a close watch on the Federal Reserve for indications of when it will start raising interest rates, the consensus among economists is that it will begin its credit-tightening cycle at some point this year.

Of course there are two sides to the interest rate coin: the investor and the borrower. Rising rates are generally good news for savers and investors, but they represent an expense for borrowers and increase the cost of taking out loans and mortgages.

In the current environment, individuals may be evaluating the potential benefits of converting variable-rate loans, including adjustable rate mortgages (ARMs), home equity lines of credit, and student loans, to a fixed rate.

Only One Way to Go

Interest rates are still at historic lows and are only likely to go up from here. Personal finance experts typically favor refinancing, when practical, to a fixed rate for the stability it provides the borrower. With a fixed-rate loan the borrower will not have to be concerned if there is a sudden spike in interest rates. What’s more, individuals with fixed-rate debt have much more control over their budget and can plan ahead with more confidence, as they have a clear, predictable picture of their monthly income and expenses.

While adjustable-rate loans may have lower initial interest rates than fixed-rate loans, the lower interest rate is only for a set period of time. At the end of the fixed period, the monthly loan amount “adjusts” based on the market rate or index. In this case, refinancing may be a smart choice if your ARM is adjusting to an interest rate that is higher than the current market rate.

How Low Are Rates?

Just how low are short-term rates now, historically speaking? Most lenders base their variable rates off a LIBOR rate, which stands for London Interbank Offered Rate and works as a benchmark rate for banks internationally.1 As the LIBOR changes, so does the variable rate. The LIBOR is low today, compared to its 10-year and 20-year averages (see table below), but once it begins to increase, borrowers holding adjustable rate loans will see an increase in their regular payments. While most variable rate loans will have an upper interest rate cap, it is important to know what that maximum rate is — and whether you could handle that potential debt load — before signing any documents.

LIBOR — Then and Now

10-year average 20-year average July 6, 2015
6-month LIBOR 1.95% 3.09% 0.44%
12-month LIBOR 2.17% 3.29% 0.76%

Source: Federal Reserve Economic Data (FRED). For the dates indicated. The 10-year and 20-year averages are for the period ended July 6, 2015.

Generally, a variable rate loan is a safe bet for individuals who plan to repay their loan quickly, or have a short time horizon for underlying property ownership. For example, if you plan to move within 3-5 years, refinancing to a fixed rate mortgage may not be worthwhile, when you take into account the cost of refinancing compared with your monthly potential payment (interest) savings. In general, you should be able to recoup your refinancing costs within two years to make it worthwhile in the short term.

While the Federal Reserve is expected to begin raising rates soon, it is likely to take a very measured, slow path, so there’s really no need to rush into a refinancing.

If you would like to review your current loans or discuss any other financial planning matters, please don’t hesitate to contact us or visit our website at http://www.ydfs.com. We are a fee-only fiduciary financial planning firm that always puts your interests first.  If you are not a client yet, an initial consultation is complimentary and there is never any pressure or hidden sales pitch.

Source:

1 U.S. News.com, “Fixed or Variable: Which Interest Rate Should You Choose?” July 14, 2015

Rent or Buy?

If you read articles that offer budgeting advice, you might see an item that says you shouldn’t spend more than 25% of your income on housing costs. These days, that advice doesn’t apply.

Why? According to the latest report from Zillow Group, which tracks rental housing affordability, the typical renter making the median income in the U.S. spent 30.2% of her income on a median-priced apartment. This is the highest rate since Zillow started keeping statistics in 1979. The average from 1985 to 1999 was 24.4%.

The rise appears to be driven by greater demand for apartments and rental units. In the second quarter of this year, due to strict lending standards, the U.S. homeownership rate fell to the lowest level in almost five decades, forcing a greater number of people into the rental market. However, those fortunate enough to obtain mortgage loans appear to be much better off than renters. With today’s low interest rates, homeowners are paying, on average, 15% of their income in mortgage payments, well below the historical average of 21%.

Zillow found that rents were least affordable in Los Angeles, where residents were paying 49 percent of monthly income. The share in San Francisco was 47 percent, 45 percent in Miami, and 41 percent in the New York metro area.

If you would like to discuss whether renting or buying makes more sense for you or talk about any other financial planning matters, please don’t hesitate to contact us or visit our website at http://www.ydfs.com. We are a fee-only fiduciary financial planning firm that always puts your interests first.  If you are not a client yet, an initial consultation is complimentary and there is never any pressure or hidden sales pitch.

Sources:

http://www.bloomberg.com/news/articles/2015-08-13/renting-in-america-has-never-been-this-expensive

The MoneyGeek thanks guest writer Bob Veres for his contribution to this post

What’s Going on in the Markets September 7 2015

Chances are, these days you’re sneaking a peak at the investment markets, probably more than once a day. They’ve certainly been providing their share of excitement: down 4% one day, up more than 2% the next day or two, and who knows what’s causing the turmoil? Last week, the S&P 500 index and Dow Jones Industrial Averages (DJIA) were both down about 3%.

In August, the direction was mostly down, turning what had been tentative gains for the year into (as yet) relatively modest losses. And there wasn’t a lot of value in diversification. Large cap, midcap and small cap U.S. stock indices all dropped between 5.5% and 6%, real estate fell about the same and foreign stocks dropped roughly 7% over the same time period. Commodities did worse.

Analysts are scrambling to tell us why, one day, the markets are down sharply, and then come up with a reason why, the next day, they’re back up again. One long-term trader remarked, watching these swings, that the fact that the Dow can fall 1,000 points and then recover 700 in the space of four hours is prima facie evidence that there is no rational explanation for what’s going on. We hear that the weakness in the Chinese economy, or its stock market, are causing U.S. stocks to somehow be less valuable, but does anybody really believe that?

Meanwhile, the doomsayers are predicting catastrophe—which is not well-defined, but seems to mean that U.S. companies will be 30% to 50% less valuable in a few weeks than they are today. Their solution? Buy gold! It’s helpful to remember that $10 invested in gold in 1926 would be worth $615 today. Ten dollars invested in the stock market would be worth $55,000.

Perhaps the most interesting analysis came from Jason Zweig, who writes an investment column for the Wall Street Journal. He said that this would never happen, but what if there were a Ben Graham TV channel, which provided market commentary based on the teachings of the father of value investing? You’d have the host coming on to announce some great news: stocks today are unexpectedly on sale, selling, on average, 4% cheaper than they did yesterday. Will this great news continue, or should we take advantage of the buying opportunity while it lasts?

The guest that day offers his hope that the markets will continue their downward rally, making stocks even cheaper to buy. But he’s not optimistic, given the fact that stocks seem to get relentlessly more expensive over time, and have been doing this, with some regularity, since the early 1800s. Still, one can hope for a sustained downturn that would provide a chance to buy at prices even lower than they are today.

The host and guest console themselves with the thought that finally, for the first time in seven years, we may finish out the year with an opportunity to buy stocks for less than they cost on January 1.

We may not get that lucky, and the markets may continue their bull run. Nobody knows what you’re going to see the next time you check the investment tables, or what will happen between now and the end of the year—except this: the actual value of American and global companies won’t be affected by the mood swings of investors who lurch between an inclination to buy and an inclination to sell. Whatever those underlying values are, the markets will eventually return to them, however much of a bargain the market decides to offer us between now and then.

From an economic standpoint, the data still supports further growth in the U.S. economy. Even though both the Institute for Supply Management surveys for manufacturing and services ticked down slightly in August, they remain in expansion territory. August’s employment report released last Friday, showed that the unemployment rate moved down to 5.1%. Job creation was less than economists had expected; however, figures for June and July were revised upward, and it’s possible that the August (estimate) could also be adjusted higher, once the start of the school year is taken into account.

There has been little change in the technical picture of the markets. The Advance-Decline Line (number of stocks going up versus going down) is still weak. However, downside leadership eased somewhat during the week, and selling pressure hit an extreme last Tuesday, which was followed by a triple-digit rebound in the DJIA on Wednesday.  Extreme oversold readings, which often occur at the end of a downward move, can indicate that the bottom of a correction is imminent. However, a failure of the market to bounce in view of extreme oversold readings, can be a bear market warning sign. We’re watching this closely.

In view of the volatility still present in equity markets, it’s important to stay objective. The economic data is solid; yet we are concerned with the technical market picture and the Federal Reserve policy announcement on September 17. Currently, our client portfolios are defensively positioned, and further defensive adjustments will depend on how the evidence emerges in coming weeks. Once again, if you find yourself uncomfortable with the market gyrations, or you’re losing sleep, then perhaps you should take advantage of the rallies in the markets to lighten up on some of your positions (this is not to be construed as investment advice; please consult with your financial adviser, or better yet, call us!).

If you would like to review your current investment portfolio or discuss any other financial planning matters, please don’t hesitate to contact us or visit our website at http://www.ydfs.com. We are a fee-only fiduciary financial planning firm that always puts your interests first.  If you are not a client yet, an initial consultation is complimentary and there is never any pressure or hidden sales pitch.

Sources:

Wilshire index data: http://www.wilshire.com/Indexes/calculator/

Russell index data: http://www.russell.com/indexes/data/daily_total_returns_us.asp

S&P index data: http://www.standardandpoors.com/indices/sp-500/en/us/?indexId=spusa-500-usduf–p-us-l–

http://www.tradingeconomics.com/united-states/unemployment-rate

Nasdaq index data: http://quicktake.morningstar.com/Index/IndexCharts.aspx?Symbol=COMP

International indices: http://www.mscibarra.com/products/indices/international_equity_indices/performance.html

http://finance.yahoo.com/news/dow-briefly-drops-150-points-135905615.html

Investech Research

The MoneyGeek thanks guest writer Bob Veres for his contribution to this post

What’s Going On in the Markets August 23, 2015

Some of the most entertaining times to be a long-term investor are those periods when short-term investors are looking over their shoulders for an excuse to sell. They’re convinced that the market is heading down before they can get out, and so they jump on any bad news that comes across their Bloomberg screen.

Last Thursday and Friday was a marvelous time to see this in action. With all the economic drama playing out in the world, there were plenty of opportunities to panic. The Greek Prime Minister has resigned! Sell! … China devalued its currency a few days ago by 2%! Head for the hills! … Chinese stocks are tanking yet again! Get out of American stocks while you can! … The Fed might raise short-term interest rates from zero to very nearly zero! It’s the end of the world!

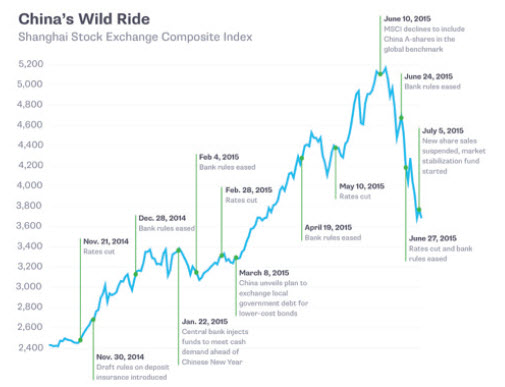
Of course, a sober analyst might wonder whether a change in governance in a country whose GDP is a little less than half the market capitalization of Apple Corporation, is really going to move the needle on the value of U.S. stocks—especially now that Greece seems to have gotten the bailout it needs to stay in the Eurozone. Chinese speculators are surely feeling pain as the Shanghai Composite Index goes into free-fall, but most U.S. investors are prohibited from investing in most companies in this tanking market. If the market value of PetroChina, China Petroleum & Chemical and China Merchants Bank are less valuable today than they were a week or a month ago, does that mean that one should abandon U.S. stocks? Does it mean that American blue chips are somehow less valuable?

What makes this dynamic entertaining—and sometimes scary—is the enhanced volatility around very little actual movement. You see the market jump higher and faster, lower and faster, but generally returning to the starting point as people realize a day or two later that the panic was an overreaction; and so was the false exuberance of realizing that the world isn’t going to come to an end just because we’re paying less at the gas pump than we were last year. Despite all the jitters investors have experienced over the past nine months, and despite the drop last week, the S&P 500 is only down about 4% for the year, and was in positive territory as recently as August 19.

Let’s summarize a few of the facts about this current sell-off:

  • Friday’s decline was 500 points in the Dow Jones Industrial Average (DJIA), which was 3.1%. During this bull market there have been 11 similar daily declines of that size (or larger), and in every instance the market went on to new highs. So Friday’s decline, by itself, does not mean that we’re in a bear market.
  • Last week’s loss in the S&P 500 Index was 5.77%. Since 1940, there have been 38 weekly declines of this size (or larger). Surprisingly, there were three times as many double-digit gains three months later than there were double-digit losses. So last week’s decline doesn’t necessarily indicate more big losses ahead.
  • Market readings are at the most oversold level since the 2011 correction lows. Historically, readings this low indicate a high probability of a rally or bounce in the week ahead.
  • For perspective… from the market peak earlier this year, the DJIA is off 10.1% through Friday’s close, and the S&P 500 Index is off only 7.5%. So far, this barely qualifies as a correction. And the last 10% correction was in 2011, so this was overdue. Since the year 1900, there have been 35 declines of 10% or more in the S&P 500. Of those 35 corrections the index fully recovered its value after an average of about 10 months. Sure, there’s no guarantee that the length of future recoveries will happen in a similar time frame, but the long term bias of the market is always up.

I’m not telling these facts to downplay the market’s weakness (which I’ve been telling clients to expect), but to convey that this correction may not be a full scale bear market. Bull market tops are long, drawn-out affairs. And while negative technical market signals have been building for the past few months, I cannot say with certainty that we are in a bear market…at least not yet.

Another positive development –not yet considered by today’s panicked sellers– is that this market weakness has likely taken the chance of any September interest rate hike by the Federal Reserve completely off the table. In fact, we’ll be surprised if Fed officials are not cajoling the markets with dovish comments this coming week to calm investor nerves and stabilize Wall Street.

If you want a broader, more rational picture of our current economic situation, read this analysis by a long-term trader who now refers to himself as a “reformed broker” in Fortune magazine: http://fortune.com/2015/08/20/american-economy-worries/. He talks about the “terrible news” that it hasn’t been this cheap to fill your gas tank in over a decade, and businesses that rely on energy to manufacture their goods, are now forced to figure out what to do with the excess capital they’re not spending on fuel. (warning: sarcasm to follow).

Oh, but it gets worse. American corporations are struggling under the burden of enormous piles of cash they don’t have a use for. They may have no choice but to return some of that money back to shareholders in the form of record dividends or stock buybacks. Of course, you read about the risk to corporate profit margins. It seems that unemployment is so low that wages for American workers are going up, and that could raise consumption and demand for products and services.

Meanwhile, contributions to 401(k) and other retirement plans are up dramatically, housing starts and the construction sector are booming, America’s biggest global economic competitor (China) is reeling, and the Federal Reserve might decide that it no longer has to keep short-term interest rates low because the emergency is over and the economy has recovered.

The author apologizes (tongue in cheek) for bringing us all this terrible news, but hey, we can always sell our stocks and get out until conditions improve. Right?

Nobody would be surprised if the U.S. stock market suffered a 10% or even a 20% short-term decline (correction) this year, or perhaps next year. Besides, we haven’t had a 10%+ correction in nearly four years. But what can you do with that information?

Nobody would have been surprised if this had happened at any point in the long bull market that may have doubled your stock investments, and nobody can predict whether Friday was a signal that the market will take a pause, or if Monday will bring us another wave of short-term euphoria measured mostly in sighs of relief. And if you don’t know when to sell in this jittery market, how will you know when to buy back in?

These short-term swings provide entertainment, but very little useful information for a mature investor. If you aren’t entertained by watching people sell in a panic and then panic-buy their way back in when they realize things aren’t as dire as the headlines made them out to be, then you should probably watch a movie instead.

What To Do

It is likely the media will have a heyday with the recent losses, and perhaps showcase predictions of much more dire things to come. The media is all about getting you to tune in, not to help you with investment decisions. When things are good, they highlight how great things are, and when things turn south they jump on the bandwagon and act like there won’t be a tomorrow. It’s best to tune them out.

As mentioned above, we are way overdue for a correction. Over the past six years, there has been much less volatility in the markets than there usually is. We have become a bit desensitized to how stock markets actually move. Losing 10% – 20% over a period of months is not unique. Markets go up and down; that’s why stocks pay us a premium to own them. Every time something different causes it and each time it instills a lot of fear. This time and times in the future will be no different.

If you have at least five to seven years until you plan to fully cash out of your account, then you have nothing to worry about. Even if we were to get a protracted downturn, it wouldn’t matter for long-term investors; in fact it can benefit you.

If the markets go down significantly more, expect to take advantage of the weakness and buy high quality stocks “on sale”. It’s never easy to buy stocks after seeing them go down, but it can really help your returns over time. A 5% correction is not sufficient to do this. I’d be looking for a 10% – 20% correction before putting more money to work.

Diversified portfolios, which you must have, ensure that your investments don’t move in line with the market. Sure, you don’t go up as much as the market, but you also don’t go down as much. And by having assets that do well in tough times such as cash, short-term bonds and inverse funds, we have the ability to actually purchase stocks on sale – to take advantage of temporary losses for your long term gain. The key is to think long term (five years or more) and ignore the short term stuff.

While I have no specific knowledge (or a working crystal ball), my guess is that the market highs are in for this year. That doesn’t mean we go down from here; it just means that it gets harder to make new highs before year end. Of course, I could be wrong!

In our client portfolios, we have been building up cash positions, taking profits on some positions, increasing our allocations to defensive sectors, and adding to our hedges for months now. If you’re wondering what to do, you might consider lightening up on some profitable positions into the next rebound if you haven’t already done so (this is not intended as investment advice-please check with your advisor so that changes made to your investments are consistent with your financial plan, risk tolerance and time horizon).

Because Friday closed on the lows, we could very well see selling pressure spill over into this week. Even so, we do not see last week’s swoon as the start of a waterfall decline or market crash. Taking into account how bull market tops unfold, we believe this top (if it indeed is one) will take more time to develop and offer more convincing evidence of a bear market.

We will be closely watching the coming rebound. If we continue to see deterioration in breadth/leadership (the number of stocks going up are less than those going down), and the technical health of the markets deteriorate, then we will increase our cash reserves, hedges and defensive sector allocations. If this turns out to be a wonderful buying opportunity, then we may not catch the absolute bottom, but there will be plenty of time to take advantage of this latest “dip”.

If you would like to review your current investment portfolio or discuss any other financial planning matters, please don’t hesitate to contact us or visit our website at http://www.ydfs.com. We are a fee-only fiduciary financial planning firm that always puts your interests first.  If you are not a client yet, an initial consultation is complimentary and there is never any pressure or hidden sales pitch.

Sources:

Bob Veres, Inside Information

Investech Research

Devaluation Panic: Bear in the China Shop

Earlier this summer, China’s stock market appeared to be in free-fall, despite the Chinese government’s efforts to control stock prices and stem the panic. The chief culprit appears to be leverage: investors last year and in the first half of this year borrowed billions in order to buy stocks on margin, offering little or no collateral except the shares themselves. As prices fall and stock values drop below the level of debt, it triggers margin calls from the lenders, which forces investors to sell at any price, further depressing prices, causing more margin calls in a downward spiral whose bottom is not easy to see from here.

A recent report said that the volume of these margin loans dropped by 6%, or $23 billion over five trading days, which implies that there is still $383 billion more that could be called over the next months or years, an alarming 9% of the roughly $4 trillion in total market value on the Shanghai market.

But leverage is only part of the problem. The CSI Information Technology Index, a mix of high-tech names in China similar to the NASDAQ in the U.S., is still trading at a multiple of around 75 times earnings (PE), while NASDAQ’s PE is closer to 30. If the two indices were to normalize, it would imply that Chinese stocks could drop an additional 60% in value before the current bear market has run its course—and that’s assuming the debt situation doesn’t cause the market to overshoot on the downside. Some compare the situation in China to the dot-com bust in the year 2000.

One complication in the situation is the fact that, since late last year, foreign investors have been allowed to invest directly in Shanghai-listed stocks. Savvy market traders with years of experience in these death spiral events have been making program trades which bet on further drops. Chinese regulators recently suspended 34 U.S.-based hedge fund accounts from trading, including the Citadel Fund, and short selling is now totally forbidden.  Arrests for selling stocks short have been reported.

Currency Devaluation

This past week, investors across the globe were sent into a panic when the Chinese Central Bank devalued the nation’s currency, the yuan. The U.S. market temporarily lost more than 1% of its total value, oil prices fell, and global shares plummeted on news that China decided to make its currency two percent cheaper than it was before. Despite the Central Bank’s assertion that it was a one-and-done devaluation, they proceeded to further devalue the yuan two more times within a matter of days.

You actually read that right. Headlines raised the prospect of a global currency war, and there were hints in the press that nations might resort to trade barriers, which would slow down global trade in all directions. If you’re following the story, you probably didn’t read that the Chinese yuan, even after the devaluation, was actually more valuable against global currencies than it was a year ago in trade-weighted terms. Nor did you read that China actually intervened in the global markets to make sure the devaluation didn’t go any further in open market trading.

The background for the devaluation is China’s slowing economic growth and its recent stock market volatility. The Caixin China Manufacturing Purchasing Manager’s Index recently fell to levels which indicate economic contraction, and industrial output is at the weakest level since November of 2011. If you can believe the numbers, the country is on track for a 7% growth rate this year—three times the U.S. rate, but sluggish by recent Chinese standards, and quite possibly unacceptable to the country’s leaders.

You probably already know that the Chinese stock market climbed to impossibly high levels earlier this year and then fell just as far in a matter of weeks. As you can see from the below chart (and as mentioned above), the Chinese government marched into the chaos with a heavy hand, outlawing short sales, banishing hedge funds to the sidelines, suspending margin calls and even buying stocks directly in an effort to put a floor on prices. The theory was that the devaluation was part of this intervention, since it would make exports cheaper and boost sales, raising profit margins of those companies whose stocks were recently free-falling. Some believe that the Chinese won’t quit until they devalue the yuan by at least 10%.

CA - 2015-8-14 - China Devaluation1

A more nuanced view of the situation is that the recent depreciation is a small step to keep the yuan’s value in line with those of its peers, not a dramatic shift in exchange-rate policy or a part of the Great Shanghai Market Panic. Indeed, if you look at the below chart, you can see that China’s percentage of world exports has been steadily growing for this entire century, without any need to add the stimulus of a weaker currency.

CA - 2015-8-14 - China Devaluation2

A scarier scenario, which nobody seems to be talking about, is that China’s endgame goal is to make the yuan the reserve currency for global trade—replacing the U.S. dollar. China is already lobbying to join the list of reserve currencies recognized by the International Monetary Fund. The new exchange rate is more in line with basic economic fundamentals, strengthening the argument that the yuan is not under the total control of an interventionist central government. But so long as China imposes strict limits on the amount of its currency that can flow into and out of the country, and attempting to manipulate its own stock market, this will be a difficult argument to make.

You don’t often see a market rally when an economy is sliding into recession, so at these valuations, you aren’t likely to find many bulls left in the Shanghai China shop either.

If you would like to review your current investment portfolio or discuss any other financial planning matters, please don’t hesitate to contact us or visit our website at http://www.ydfs.com. We are a fee-only fiduciary financial planning firm that always puts your interests first.  If you are not a client yet, an initial consultation is complimentary and there is never any pressure or hidden sales pitch.

Sources:

http://fortune.com/2015/08/03/china-looks-for-scapegoats-in-continued-stock-market-decline/

http://fortune.com/2015/06/29/china-stocks-crash-into-bear-territory-as-margin-calls-bite/

http://www.ft.com/intl/fastft/242222/china-overtake-japan-stock-market-cap

http://www.economist.com/news/finance-and-economics/21661018-cheaper-yuan-and-americas-looming-rate-rise-rattle-world-economy-yuan-thing?fsrc=scn/tw/te/pe/ed/yuanthingafteranother

http://www.bloombergview.com/quicktake/chinas-managed-markets

http://finance.yahoo.com/news/global-markets-china-devaluation-hits-165238168.html

http://www.bloomberg.com/news/articles/2015-08-13/china-citigroup-agree-there-s-no-need-for-big-yuan-devaluation

The MoneyGeek thanks guest writer Bob Veres for his contribution to this post

Surprise! Doom and Gloom Sells

Maybe you saw the alarming headline in the middle of the other stories on Yahoo! News, which told you that the U.S. dollar was about to collapse, as a result of H.R. 2847—or, sometimes, simply “the new currency law.” Write down this date, the frightening article said: July 1, 2014.

More recently, you might have seen/heard TV and radio advertisements or ubiquitous Internet warnings where Dr. Ron Paul urgently reveals “a real currency crisis” that will usher in the greatest economic meltdown this country has seen in 50 years—including civil unrest, pension fund collapses, the erosion of personal liberties, bank and brokerage closings, and mass rejection of the U.S. dollar in favor of “non-paper alternatives.”

In case you were wondering, the U.S. dollar did not collapse in July of last year, nor did it collapse in 2009, which is when Ron Paul began predicting doomsday. But if you watch the 54-minute Ron Paul infomercial, you will eventually be offered a “survival blueprint” published by Stansberry & Associates Investment Research—interestingly, the same company that told us that the U.S. currency would melt down last year. To avoid financial armageddon, you simply need to pay $49.50.

Who is Stansberry & Associates? The owner and publisher is Frank Porter Stansberry, who, among his credentials, has been prosecuted by the Securities & Exchange Commission for investment fraud, and fined $1.5 million for selling $1,000 reports with information that a panel of judges determined that he knew not to be true. Using the pseudonym “Jay McDaniel,” Stansberry offered a “Super Insider Tip” telling gullible investors that on May 14, 2002, there would be a major announcement which would instantly double their money. As it turned out, the uranium processing company that was being touted in the $1,000 report made no significant announcement on the date in question, and in fact investors testified that they lost 20-25% of their investment portfolio after purchasing the stock and options.

In the judge’s opinion, “The gravity of the harm in this case is not limited to the amount of money each purchaser spent for the Special Report. Approximately 1,217 investors bought the Special Report with the expectations, as promised, by the Super Insider Solicitation.” Stansberry and his publisher were enjoined from conducting any additional “deliberate fraud.” An investigative website also notes that he predicted the demise of AT&T, General Motors, the FNMA quasi-governmental guarantor of mortgages, Continental Airlines and… General Electric. One thing these predictions have in common with the prediction of the collapse of the dollar: they never happened. In 2011, Stansberry’s online infomercial predicted “The End of America,” and also that Germany would leave the European Union. To our knowledge, those things haven’t happened yet either.

In case you were wondering, H.R. 2847 is a provision that requires Americans living abroad to comply with tighter reporting requirements on their offshore income—and has very little to do with anything related to the dollar.

Predicting disaster is a reliable way to make money, because the human mind is wired to pay more attention to threats than to the more benign elements in our environment. In the future, you’ll probably see Stansberry predicting all sorts of other scary things, and probably a few more “can’t miss” investment opportunities. What you won’t see is any clear accounting of his track record.

Write down this date about the collapse of America, the extinction of the dollar, the demise of senior members of the Fortune 500, the total breakup of the European Union and a great chance to double your money in a day: Not on Porter Stansberry’s timetable.

Another outlet of bearishness, Casey Research, was recently acquired by Stansberry and Associates. Casey is also a flamboyant (and spammy) research firm, so I don’t expect the doom and gloom headlines to die down any time soon. These folks have been calling for the demise of the United States and the dollar for years, and people love to read fearful headlines. Most of these outfits have caused their readers to miss out on the last six years of stock market gains. Instead, they have led folks to invest in gold, gold mining stocks, commodities and other precious metals that have lost half or more of their value since 2011. You can save your time and safely ignore this trash designed to get you scared witless.

Just like in the media, fear sells, but if the dollar is doomed, we all have bigger problems to deal with. Instead of cash or gold, I’d rather have my home stocked with drinking water, flour, cans of tuna fish and the finest shot gun I can find if the dollar or market collapses. Oh and some fine beer or wine too, if that’s what you fancy.

While I personally believe that the market is way overdue for a 10% or more correction, the market doesn’t care what I believe.  Still, I don’t consider the situation as dire and desperate as these doom and gloomers describe it. The country’s economy is doing great, unemployment is the lowest it’s been and there are currently no signs of an impending recession. Nonetheless, while a crisis could develop anytime without notice somewhere around the world, our client portfolios are hedged and positioned defensively for whatever the market throws at us.

If you would like to review your current investment portfolio or discuss any other financial planning matters, please don’t hesitate to contact us or visit our website at http://www.ydfs.com. We are a fee-only fiduciary financial planning firm that always puts your interests first.  If you are not a client yet, an initial consultation is complimentary and there is never any pressure or hidden sales pitch.

Sources:

http://briandeer.com/vaxgen/stansberry-fraud.htm

http://thecrux.com/porter-stansberry-predicts-the-next-major-company-to-go-bust/

http://wealthymatters.com/2011/09/20/porter-stansberry/

http://thecrux.com/dyncontent/ron-paul-one-step-prepare/?cid=MKT033949&eid=MKT057529

http://www.snopes.com/politics/conspiracy/hr2847.asp

The MoneyGeek thanks guest writer Bob Veres for his contribution to this post